Last week’s article called for a large drop to 4325-37 to flush out late bulls. This nearly played out as the S&P 500 (SPY) fell to 4341 on Friday and the ‘Fed pause’ buyers who chased the rally in the 4400s all the way to 4448 will surely be feeling the pressure. Dip buyers have also been thwarted as Friday closed just 7 points above the weekly low. But have they capitulated? What needs to happen for the trend to either continue or break lower?
To answer these questions, a variety of technical analysis techniques will be applied to the S&P 500 in multiple timeframes. The aim is to provide an actionable guide with directional bias, important levels and expectations for price action. I will then use the evidence to make a call for the week ahead.
S&P 500 Monthly
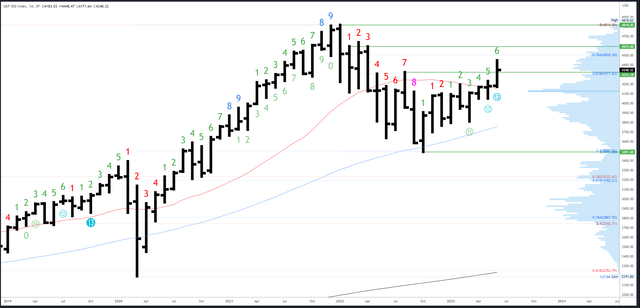
The June bar closes on Friday and this will also be the close of the quarterly bar. It’s not often a quarterly bar closes on a Friday, and when it happened in Q1 there was a late surge from Wednesday onwards. Given the strength of the trend in June, more ‘window dressing’ is likely and I’d expect the close to be nearer 4400 than 4300. Any close below 4325 would be a warning to the bulls.
SPX Monthly (Tradingview)
There is minor resistance at the 76.4% Fib at 4505, followed by monthly references starting at 4593.
4325 is potential support, then 4230 at last month’s high, with 4195-200 a major level just below.
An upside Demark exhaustion count is on bar 6 (of 9).
S&P 500 Weekly
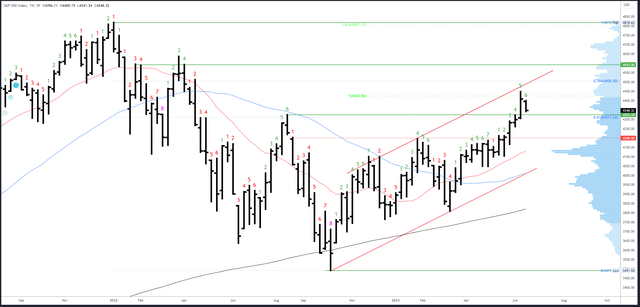
This week’s action created an ‘inside bar,’ which is overall neutral, although the weak close near the lows gives some downside bias to at least test below 4341.
Despite the 100 point drop, a proper weekly reversal pattern has not yet formed. However, as pointed out last week, one can still develop and there are similarities with the pattern from the 30th January onwards which rolled over into a large correction (eventually forming an ‘inside and down’ reversal). This is something I will continue to monitor in the coming weeks if new highs are not made.
SPX Weekly (Tradingview)
4448 is initial resistance. This wasn’t an obvious place to top, but was at the top of the daily channel (as shown on charts last week), plus a measured move came in at 4425. 4505-4512 is the next resistance.
4322-25 is now initial support, and there is a weekly gap fill at 4298.
An upside (Demark) exhaustion count will be on bar 7 (of 9) next week.
S&P 500 Daily
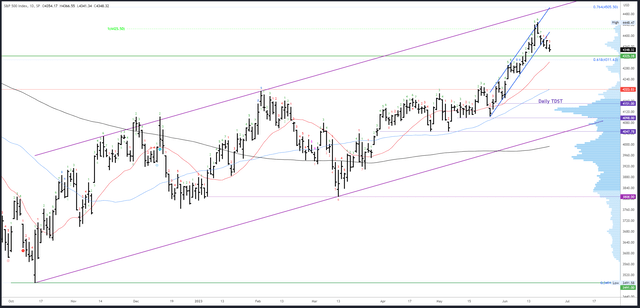
Last week’s article highlighted the vulnerability of the near-term trend channel and warned, “expect a small bounce followed by a break lower.” This is exactly what happened on Tuesday and Wednesday, and the break lower signals this particular phase of the trend is over.
Another trend can develop, but retrace levels should hold to keep the larger trend valid. I use Fibonacci levels as a guide, and the 38.2% Fib at 4316 is the ‘usual’ retrace of a correction in this location.
SPX Daily (Tradingview)
Minor resistance from last week’s drop comes in at 4362 and at the 4400-4409 gap, then the 4448 high.
The post-Fed low of 4337 is the first potential support, with the obvious 4325 monthly level just below. The 20dma is rising around 12 points each day and will be at 4315 on Monday.
A new downside exhaustion (Demark) will be on bar 4 (of 9) on Monday and could prompt a reaction from Friday onwards should price continue lower.
Events Next Week
Chairs/Presidents/Governors from a number of central banks are all speaking on Wednesday at the ECB Forum in Sintra. This could spark short-term volatility, but surely everything that needs to be said is already out there after so many recent meetings and speeches. Expect a unified hawkish rhetoric but no real surprises or significant price moves.
The main data highlights in the US come from Consumer Confidence on Tuesday, Unemployment Claims on Thursday and Friday’s Core PCE Price Index. The latter two are key as the tight labor market and sticky core inflation are the only real reasons for continued Fed hawkishness.
Probable Moves Next Week
Price has dropped near support levels, but Friday’s action suggests more downside is needed to complete the correction. Monday/Tuesday could stay weak and continue this week’s theme with lower lows and possibly a final capitulation.
Dip buyers will be active in the 4325-37 support area, but we saw this week the market is trying to shake these traders out. I prefer to see big levels such as 4325 spiked (i.e. pushed through temporarily) and then recover. I will therefore look slightly lower to the 4316 Fib level as an ideal spot for the correction to complete. Even this may not be low enough to cause panic, and weekly gap fill at 4298 is possible.
With end of quarter ‘window dressing’ likely later in the week, any flush lower in the first part of the week should recover. Strong sessions on Thursday and Friday could take the S&P500 back near 4400. This would bode well for a full recovery and new highs in July.
On the other hand, any close near 4300 would suggest the S&P500 topped at 4448 for a large correction to 4130, potentially lower.
Read the full article here


