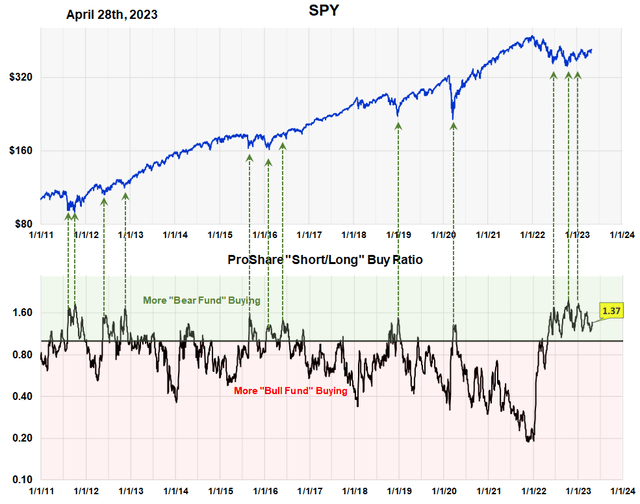
The Sentiment King ProShares buying ratio measures how much money is going into ProShares “short” funds compared to “long” funds. A full explanation of the ratio is found here. The graph is self-explanatory and displays the ratio’s twelve-year history. It confirms the accepted wisdom that investors should go opposite the crowd. When too many investors go “short” you want to be “long”, and vice versa.
The current ratio of 1.37 means that, on average, $13.70 is going into ProShares short funds for every $10 going into long funds. The highest historical ratio of 2.0 occurred in October at the market low.
The ProShares Short to Long Buying Ratio (Michael McDonald)
It’s important to note is that this is occurring after a five-month rally. This is a very powerful signal that prices are about to move higher as it shows widespread doubt and worry about the rally’s continuance. With this indicator we are actually measuring the famous “wall of worry.”
The “Wall of Worry”
It’s an old maxim that bull markets begin and continue by rising against a “wall of worry” and doubt. The term goes back to the 1950’s. When a bull market starts few believe the rising market is the real thing. Most think it’s a bear market rally and are looking for it to end any moment.
This quote is taken from the Ameritrade Article, “Stairs, Wall of Worry: What Stock Market Terms & Metaphors Really Mean”
Bull markets, or up-trending markets, are sometimes said to be climbing a “wall of worry,” meaning stock prices are rising despite economic uncertainty, seemingly negative news, or a lack of positive news. Coined in the 1950s, this expression “depicts a sustained stock market rise during a time of economic or financial stress,” wrote veteran wealth manager John Nicola. A market posting consistent gains, even if current events don’t look all that rosy, might be a sign of sustainable, underlying, long-term confidence or strength.
Measuring the ‘Wall of Worry”
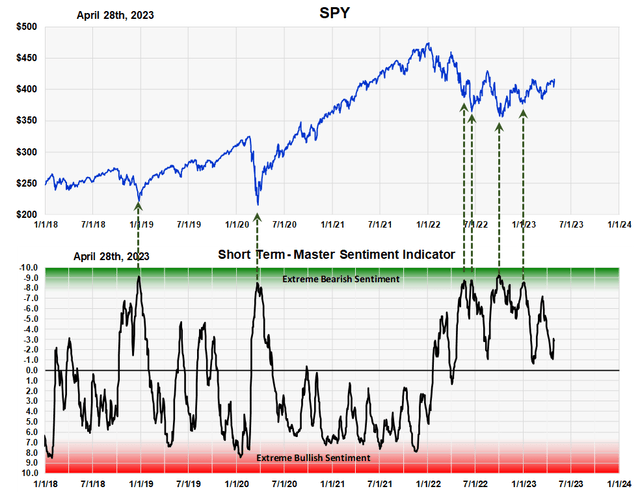
It’s one thing to talk about the wall of worry; it’s another thing to measure it. The ProShares buying ratio is one of seven indicators that make up our short-term master sentiment indicator (ST-MSI), which is a broad based index of investor expectations. At the Sentiment King we closely monitor it every day since each one of the seven indicators that make it up is calculated daily. You can find a full explanation of the ST-MSI, and the seven indicators that make it up, in this article.
The Short Term – Master Sentiment Indicator (Michael McDonald)
It’s current reading of -3 reinforces the conclusion of the ProShares buying ratio: that the classic “wall of worry” is measurably there. It suggests prices will continue to move higher until we get a reversal of this negative expectation. Investors shouldn’t worry about another market decline until the ST-MSI again moves into the red area, with investors showing some level of measurable greed and general overall bullish expectations.
For reasons explained in this February 14th article, our minimum price target for the S&P 500 continues to be 4,800, which would be a further gain of 15%.
Summary
Warren Buffett said, “be fearful when others are greedy, and greedy when others are fearful.” Notice he didn’t say “be greedy” when interest rates are low or high, or when the economy looks good or bad.
This contradiction is what makes investing so difficult. You have to ignore the economic factors making people fearful and move forward on the simple fact that they’re “fearful.” I know it sounds contrary but that’s the way it is.
We’ve been pointing this out in over twenty articles since last August. We have said, and still feel, that this is a wonderful opportunity to test the importance of monitoring investor sentiment when looking for the bottom of bear markets versus monitoring economic conditions.
Only time will tell. With no guarantees, we believe there is a high probability that prices will be higher a year from now based only on metrics of investor sentiment.
Read the full article here


