Last Fall, I wrote a cautious initiation article on the Nasdaq 100 Covered Call ETF (NASDAQ:QYLD), warning against the tradeoff the QYLD ETF makes between upside returns and premium income. Boy was I wrong.
Since my November article, the QYLD ETF has delivered almost 16% in total returns, beating the S&P 500’s 10.8% price return and ~12% total return (Figure 1).
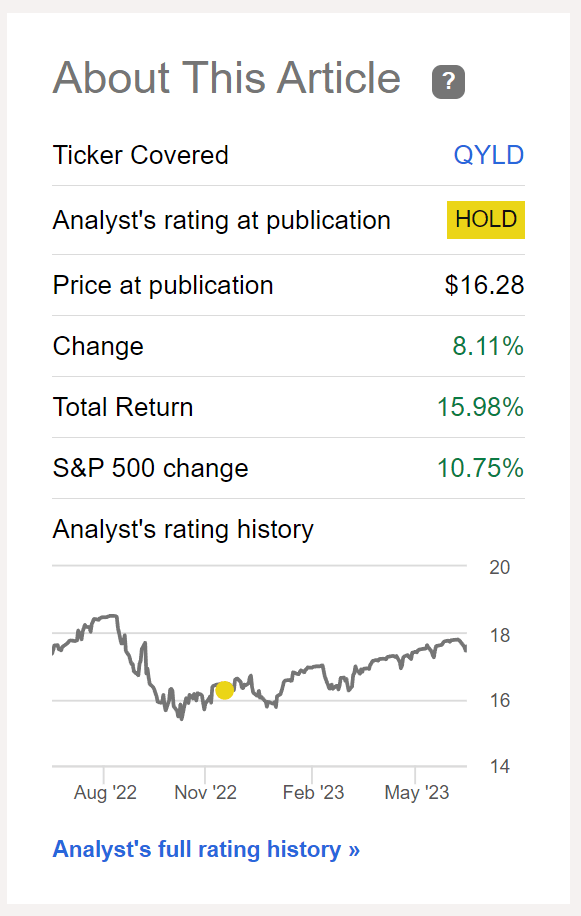
Figure 1 – QYLD has delivered 16% total returns since November (Seeking Alpha)
What happened, and what did I get wrong in my thesis on the QYLD ETF?
Brief Fund Overview
To understand the QYLD ETF’s performance and what I got wrong, we need to first understand the fund’s strategy and holdings. The QYLD ETF owns the stocks in the Nasdaq 100 Index and seeks to generate high current income through selling call options. The QYLD is a very popular ETF with almost $8.0 billion in assets and charges a 0.60% expense ratio.
The QYLD ETF achieves its investment objective by writing at-the-money (“ATM”) calls on the Nasdaq 100 Index. Moneyness refers to the strike price of options sold relative to the market price, and determines how much premiums are received vs. upside potential traded away (Figure 2).
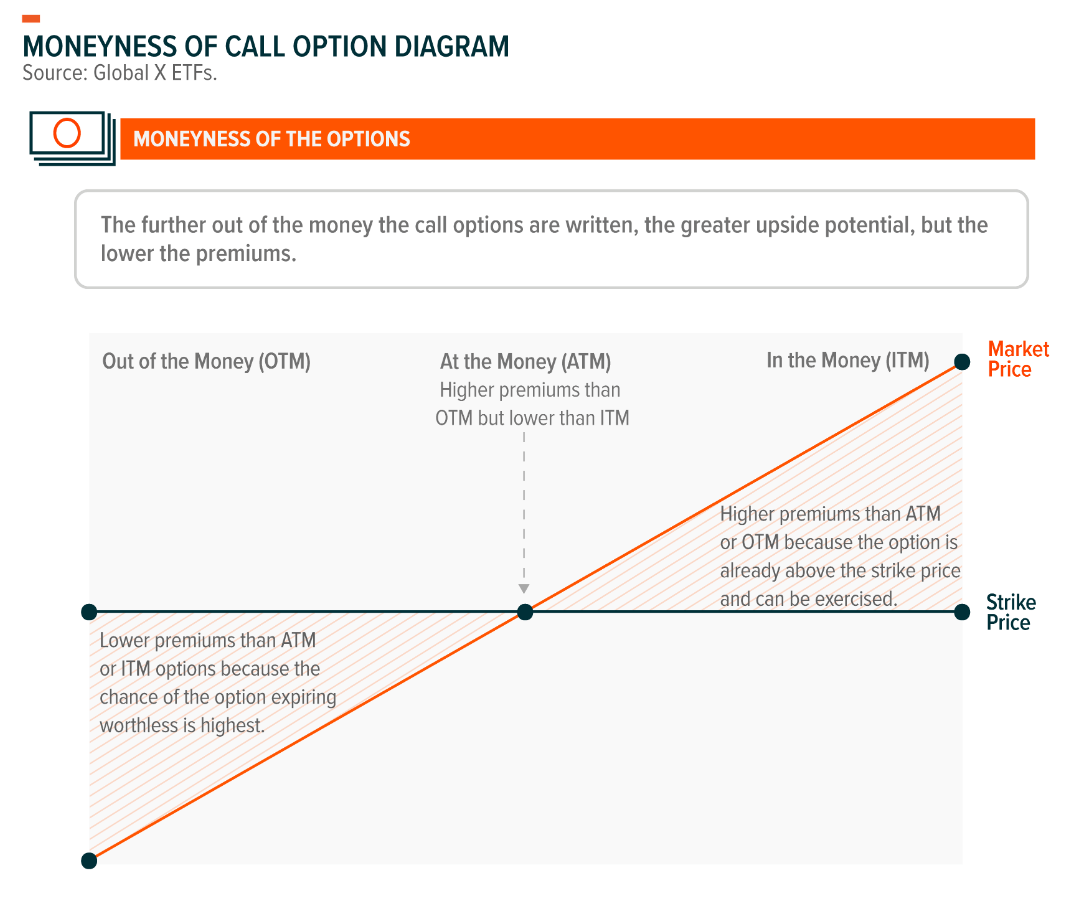
Figure 2 – Moneyness of options determine premium received (globalxetfs.com)
The QYLD ETF writes one-month ATM call options that are rolled monthly on 100% of the notional value of the fund. The premiums that QYLD generates is also dependent on the implied volatility of the Nasdaq 100 Index when the options are written; when it is more volatile, the premiums received are higher (Figure 3).
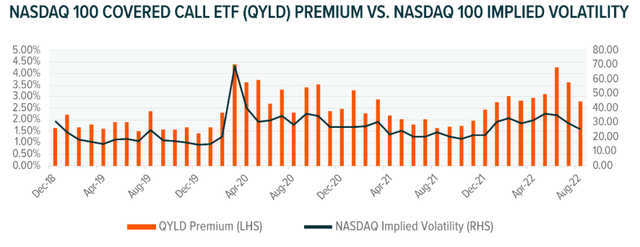
Figure 3 – Premiums received vary from implied volatility (globalxetfs.com)
Although the QYLD ETF receives 1.5% – 4% of the underlying per month as premiums, it cannot pay out the full amount as distributions, as the fund must hold back premiums to cover situations where the written options expire ‘in-the-money’.
For example, consider the situation where the QYLD ETF wrote calls on the Nasdaq 100 Index with 15,000 strike in exchange for $300. At option expiry, if the Nasdaq 100 Index is at 15,200, then the QYLD must pay out $200 to settle the difference.
Trading Upside For Premiums Underperform In The Long Run…
My concern with QYLD’s strategy and call-writing strategies in general is that in the long-run, trading upside for premiums will lead to long-term underperformance. Mathematically, we can think of the forward returns as a probability distribution.
The QYLD ETF will underperform if the Nasdaq 100 Index rallies by more than the premiums received, i.e. if the QYLD ETF received 3% of underlying as premiums but the Nasdaq 100 rallied 4%, then the QYLD ETF actually has to pay out a net 1% to settle the difference. Alternatively, if the Nasdaq 100 Index falls by more than the premiums received, then total-return wise, the investor would also lose money.
Historically, the Nasdaq 100 Index has rallied more than 3% in a month 39% of the time and has declined by more than 3% in a month 21% of the time. So ~60% of the time, the QYLD ETF may underperform (Figure 4).
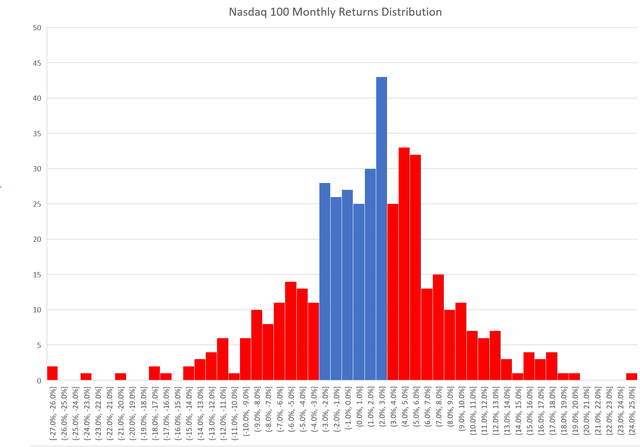
Figure 4 – Nasdaq 100 Monthly returns histogram (Author created with data from Yahoo Finance)
...But Can Have Strong Short-Term Performance
Although I am cautious on the QYLD ETF in the long-run, in the short-term, the QYLD ETF can generate strong returns if the Nasdaq 100 Index goes on a run and does not experience negative months.
In fact, since bottoming in December, the Nasdaq 100 Index, as modeled with the Invesco QQQ ETF (QQQ) that tracks the underlying index, has gone up in a near straight line, returning over 30% from when I published my article (Figure 5).
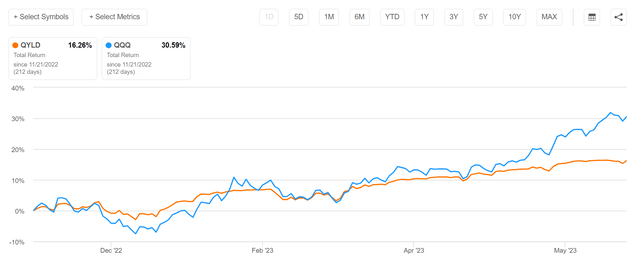
Figure 5 – QYLD and QQQ total returns from November 21, 2022 (Seeking Alpha)
However, when viewed from this perspective, we can see that QYLD’s 16% total return is not nearly as impressive, as it has lagged the QQQ ETF considerably. In fact, on any reasonably long-time frame, the QYLD ETF will dramatically underperform the QQQ ETF (Figure 6, 7, and 8).
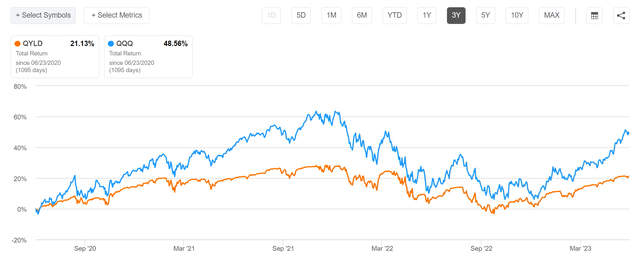
Figure 6 – QYLD vs. QQQ, 3 Years (Seeking Alpha)
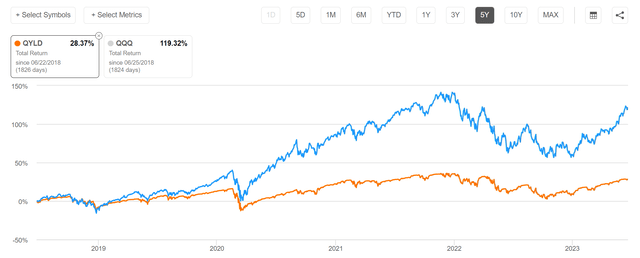
Figure 7 – QYLD vs. QQQ, 5 Years (Seeking Alpha)
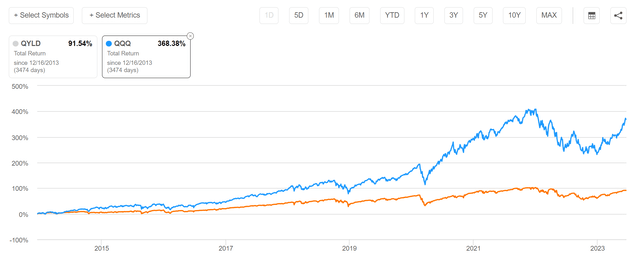
Figure 8 – QYLD vs. QQQ, since inception (Seeking Alpha)
Is This A Bubble?
The Nasdaq 100 Index has been turbocharged by megacap technology giants like Microsoft (MSFT), Apple (AAPL) and NVIDIA (NVDA) that have been called the ‘Magnificent Seven’ for generating most of the market’s total returns so far in 2023. The big question for investors is how sustainable is this rally if the leadership is so narrowly focused on a few companies?
In a recent article on the Nationwide Nasdaq-100 Risk-Managed Income ETF (NUSI), I posted the following chart and I believe it is applicable to the QYLD ETF as well (Figure 9).
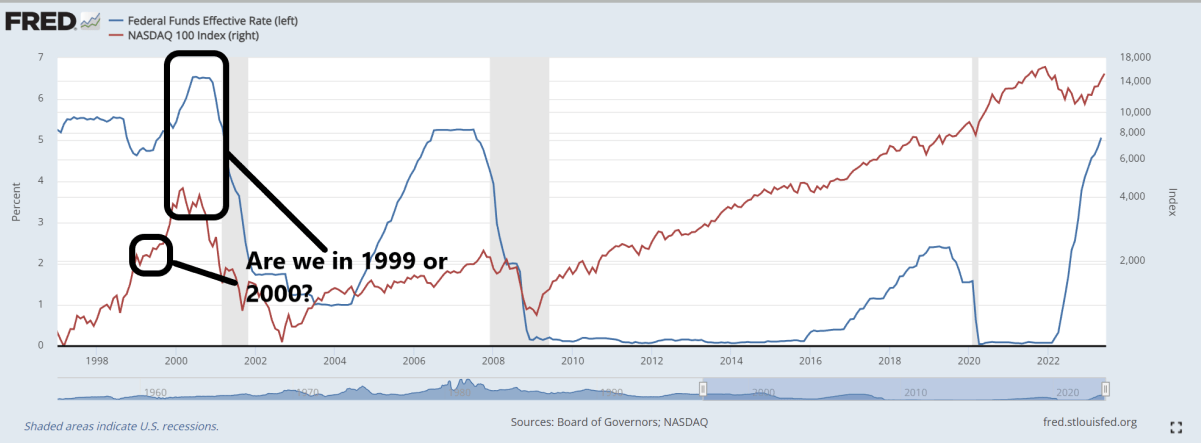
Figure 9 – Are we in circa 1999 or 2000? (Author created with data from St. Louis Fed)
Historically, I find the closest analog to the current period is the 1998-2000 Dot.com bubble. Back then, stock markets were powered by the ‘Internet’, while today, ‘Artificial Intelligence’ (“AI”) appears to be the keyword du jour. Just on June 22, 2023, Amazon (AMZN) added over $50 billion in market cap by announcing a $100 million investment in a generative AI innovation center. According to Factset, 110 companies mentioned AI on their Q1 earnings call, the most ever (Figure 10).
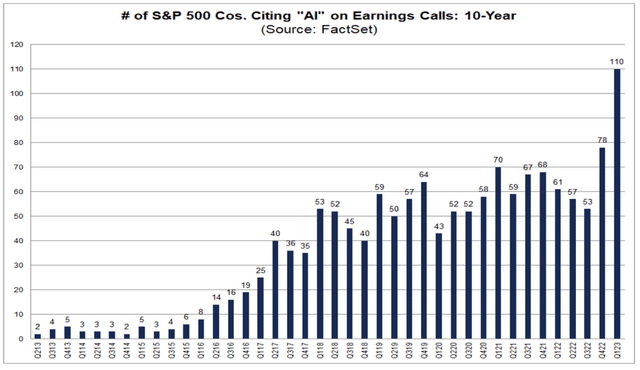
Figure 10 – Companies increasingly call out AI in a bid to juice their stock performance (Factset)
What is interesting is that not only are technology companies mentioning AI, we have real estate and consumer staples companies mentioning AI (Figure 11).
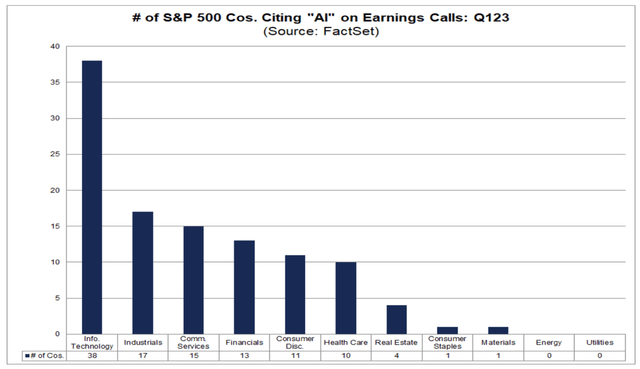
Figure 11 – Even real estate and consumer staples are calling out AI (Factset)
While history does not repeat, if does often rhymes. The question in my mind is whether we are in late 1998/early 1999, when the collapse of Long Term Capital Management (“LTCM”) led to the Federal Reserve standing pat while the Dot.com bubble inflated, or in early 2020, when the end of the Fed’s interest rate hiking cycle signaled the bursting of the bubble.
Unfortunately, I do not have a crystal ball, so all I can say is ‘enjoy the party’ while it lasts.
Conclusion
Clearly, I was wrong about the QYLD ETF in the short-term. The QYLD ETF has exceeded my expectations so far in 2023 due to an extraordinary rally in the ‘Magnificent Seven’ technology stocks, which has powered the Nasdaq 100 Index to a 30% rally in 6 months.
However, my warning is still fundamentally correct, as QYLD’s total return since November is about half of the passive QQQ ETF. On any reasonably long-time frame, the QYLD will underperform the QQQ ETF in delivering total returns.
While I can see the allure of a high distribution yield, I continue to believe investors should consider total returns instead of distribution yield when assessing investments. The QYLD ETF remains an avoid for me.
Read the full article here


