“The world is your oyster. It’s up to you to find the pearls.”
Chris Gardner, author of “The Pursuit of Happyness”
With the S&P 500 closing up ~20% from the bottom in October, many are making the call for a new bull market. This may be, but rallies this extreme are not uncommon in bear markets either. During the 2000-2002 bear market, there were three separate rallies of ~20% (April/May 2001, September-December 2001, July/August 2002).
There are of course positives that support the new BULL call. However, there is also enough evidence on the other side of the argument to keep me from going into full RISK-ON mode. While the S&P 500 managed to make it into bull market territory recently, its gain in the first eight months of the rally is just over 10% weaker than the average for all fourteen prior periods which helps to explain why, if you don’t have overexposure to Technology and Communication Services, it may not exactly feel like a bull market. I’ll need to see that change.
Furthermore, from a technical perspective, the Russell 2000 has never exhibited such relative weakness of a major bear-market low, nor has the cumulative NYSE 52-week new highs and new lows been as weak this far into a supposed bull move. With the NYSE FANG+ Index up 68% vs. the equal-weighed S&P’s 2% YTD and high beta S&P stocks still outperforming low beta by about 7%, it will be KEY to see if the staying power of the recent improvement in breadth continues.
Rather than go “all in” and “chase” parabolic moves, I’d rather be selective and wait for more evidence. This chase for performance is in full force on two fronts. AI (Artificial Intelligence) and the economic soft-landing scenarios are starting to gain more traction. While AI has the potential to be a game changer and offers significant economic impact, the question is,
“In What Time frame?”
Eventually, it will come down to corporate earnings. I suspect the July earnings season will be very telling in determining if the rally can continue. Let’s review key MACRO fundamentals that I used to make a new MACRO call on price action for the next few months.
CONSUMER
Trends in spending often take time to fully play out and changes in those trends often do that as well. Barring an external event it’s rare to see a parabolic move, up or down in overall consumer spending. We do know that “sentiment” has remained at or near historical lows for months on end. It’s no surprise, therefore, that a record high 58.6% of consumers recently surveyed said that they are living paycheck to paycheck.
While this reading briefly dipped in the early days of COVID when stimulus funds were flowing freely, as the liquidity faucet has been turned off and inflation has burned, consumers have been feeling the heat. Given these headwinds, outside of a brief period early in the pandemic, consumers expect to spend less on discretionary items than they have at any other time since 2015. That will be a drag on the economy that won’t change overnight and it is a reason I often have serious doubts about solid economic growth going forward.
The effects of inflation have canceled out all of the wage gains that have been reported. What is supposed to be a huge positive is a non-event, and at some point that matters.
INFLATION
While the MACRO view on the consumer isn’t so positive, the bigger-picture view on inflation can partially offset that headwind. Headline CPI peaked nine months ago at 9.1% and has since declined to 5.3%. Year-over-year inflation has now declined for eleven straight months. The magnitude of the decline in PPI has been even greater. In May, PPI increased by 1.1% on a y/y basis. It was the lowest level since December 2020.
Additionally, thirteen months before the March 2022 peak, PPI was increasing at a rate of 6.5%. In other words, the pace of decline in PPI has been 80% faster than the pace of increase in the thirteen months leading up to the peak.
One reason is that the China re-opening has been a dud. It was believed (as I did) that the economic impact from the re-opening would be exporting inflation around the globe. That has not occurred. Through April, headline CPI in China increased at a rate of just 0.1%. Going back to 2013, there have only been three other months where the y/y reading was lower than it is now.
Another issue putting downward pressure on inflation is the collapse of commodity prices. With a slow and questionable Chinese re-opening, oil, copper, and other economically sensitive commodities have weakened. It has been my feeling that energy prices will always be the largest impact on the inflation scene. Energy costs appear everywhere in our economy. So when energy costs were high, inflation followed, and now we have the reverse.
I will also remind everyone that the inflation issue remains a fluid situation. While it is coming down, the “easy” part has been done. Inflation remains two times the Fed’s target and going from ~4%-5% to 2% will take more time. Let’s not forget all of that stimulus money (another trillion +) that was passed in the “omnibus” bill will be starting to hit the economy as well.
ECONOMY
One last comment on the economy. Given the S&P 500-point gain since March, there is no guessing what the market believes and what is priced in. It’s now very clear that a recession is NOT priced into this market. The FED has made it clear they are not done raising rates and when they do finally STOP rates will remain higher for longer. That leaves a fluid economic situation that in my view is not yet resolved.
THE TECHNICAL SCENE
Let’s revisit the recent shorter-term analysis to set the scene before we step back and discuss the longer-term technical setup. We have already defined that we are dealing with “different” setups within the general market. The evidence is pretty clear some segments are extremely overbought and others have lagged.
We also know that the rally prompting this overbought situation has been VERY strong. The previous BULL market has taught us that strength begets strength and that it doesn’t dissipate overnight. So while the evidence suggests a general market pullback in the near term, I do expect these dips to be contained. As the situation unfolds, we always get more and more evidence of what is going on to determine our strategy, giving us a better look at the MACRO picture. It’s the reason to step back and drown out the shorter-term fundamental and technical noise.
What we are left with is a “rough roadmap” of what we can expect in price action during the next 3- 6 months or so. In deference to members of the SAVVY Investors marketplace service, the details will have to remain proprietary.
It is no secret that investors are dealing with differentiated markets that are taking different paths. The indices that have broken above their longer-term moving averages, (NASDAQ, NASDAQ 100) and those that are still trading sideways, (DJIA and Russell 2000). Now we have what appears to be the S&P attempting to confirm the message of the Technology complex. On the fundamental side, inflation is under control, the Fed is in pause mode and Artificial Intelligence is seen as the next big thing that sets off a CAPEX investment splurge adding fuel for the economy. All of that keeps the glass-half-full mindset going. Whether you believe in the AI phenomenon or not, don’t dismiss it, because in the short term that is what will help drive price action.
At some point in time, we will know IF the rest of the market catches up to the HOT sectors (positive) OR if the overall market remains more one-sided (negative). Let’s not lose sight of the fact that the US economy is still facing a very real possibility of a recession. We do not have any idea if the economic backdrop will improve enough to keep that at bay, simply because NO ONE knows the final impact of the most aggressive hiking cycle in US history. We have never seen a cycle like this and it would seem highly improbable that it will come and go without major ramifications for the economy. No one is paying attention to that now because of what I commonly call a “positive feedback” loop. No matter what information goes in, it comes back as a positive for the market. Today investors are adding up the data and believe we are in for a “soft landing”.
Because there are compelling arguments to be made for both, I don’t think we have heard the last of the debate on whether this is a NEW BULL market OR a BEAR market rally. Above all else, investors should respect the “change” in the “price action”. We’ve already seen that this market rally is not one where “all boats are being lifted”. In a recent article, I highlighted a “CHANGE” that occurred in May that I believed would make a difference in how we approach the scene.
Stay tuned it is about to get very interesting.
GLOBAL MARKETS
Coming into this week, major country stock markets have been resilient this year. Along with Japan, 8 other countries never entered bear market territory last year and remain in bull markets that began at the March 2020 lows. Historically speaking, these multi-year bull markets are now much longer than what has been typical. The size of gains off the lows are also impressive with equities in India, South Africa, Japan, and Norway all up 100%+ off their respective lows.
India is even trading at new all-time highs alongside Germany. Currently, there are only two major global economies that remain in bear markets: Switzerland and China.
The Week On Wall Street
A five-week winning streak for the S&P 500 and an eight-week positive streak for the NASDAQ set the stage for this shortened trading week. There was enough commentary over the three-day weekend highlighting how overbought the indices were that may have set the mood for the trading week.
By the time Thursday rolled around, the S&P entered the trading day on a 3-day losing streak that ended with modest gains posted across the board. Buyers decided to make it another 3-day weekend as they left the BEARS in charge on Friday. The DJIA posted its fifth straight day of losses, and the weekly winning streaks in the indices were broken. All eleven sectors were down on Friday.
The selling has been orderly and so it appears the BULLS are grudgingly giving up their gains. The S&P lost 1.3% for the week while the NASDAQ dropped 1.5%. So far this is a very modest pullback.
THE ECONOMY
Remember the recession that wasn’t a recession? I highlighted the back-to-back negative GDP prints that occurred in Q1 and Q2 last year but it sure didn’t get much attention anywhere else. It just wasn’t a popular talking point.
As long as I’ve been following the markets, two straight quarters of negative GDP has universally been the definition of a recession, but this time around, the official recession-caller, the NBER, didn’t make the call. Regardless of whether the NBER called it a recession or not, what we care about is how the market performs.
Bespoke Research published a report showing the S&P 500’s performance in the months and year following prior back-to-back quarterly GDP declines. While the three months after these events have been hit or miss for bulls, the next six months and year both saw gains 8 out of 9 times. So how did the market do this time around following the back-to-back negative GDP prints?
The S&P fell 5.3% in Q3 last year, but over the next six months, the S&P turned slightly positive, and it’s currently tracking to be up more than 15% on a full-year basis. It looks like this one is going to move from 8 for 9 to 9 for 10 in terms of the market posting gains in the year following back-to-back negative GDP prints.
Based on the next data point (and others) the probabilities of a double-dip recession keep climbing, and we can do this all over again.
U.S. Leading Economic Indicators fell -0.7% to 106.7 in May after slumping -0.6% to 107.5 in April. It is the 14th consecutive monthly decline, the worst since the 24 straight drops from April 2007 to March 2009 (the last increase in the index was in February 2022). The level is the lowest level since July 2020. Four of the 10 indicators made negative contributions, led by consumer expectations (-0.29%) and ISM new orders (-0.28%). Four indicators made positive contributions, paced by building permits (0.15). The average workweek and nondefense capital goods orders were unchanged.
LEI (www.conference-board.org/topics/us-leading-indicators)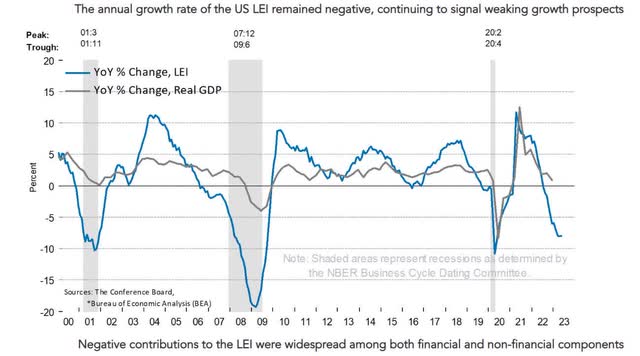
There is no way to spin or sugarcoat this poor indicator and remains my focal point for calling for a recession.
MANUFACTURING
Chicago Fed National Activity Index fell slightly to -0.15 in May. A modest decline from the -0.14 reading in April.
HOUSING
The 0.2% U.S. existing home sales rise to a 4.30 million clip in May from a 4.29 million pace slightly beating assumptions. The pace of sales has stabilized in the important spring season for the housing market at rates above deep winter lows attributable to the October cyclical peak in mortgage rates. Home inventories rose to 1,080k in May from 1,040k, versus a 9-month low of 960k in December and an all-time low of 850k in January and February of 2022. The months’ supply climbed to 3.0 in May from 2.9 in April, versus an all-time low of 1.6 in January of 2022.
The median sales price rose to $396,100 in May from $385,900.
HOUSING
National Association of Homebuilders announced yesterday that its homebuilder sentiment for June came in at a level of 55 versus expectations for a level of 51 and up from last month’s level of 50. The move back above 50 indicates that homebuilders have net positive sentiment for the first time since last July, ending a streak of ten straight months of 50 or sub-50 readings. You can’t blame homebuilders for being in such a good mood given where the housing data came in this week.
Homebuilder Sentiment (www.bespokepremoum.com)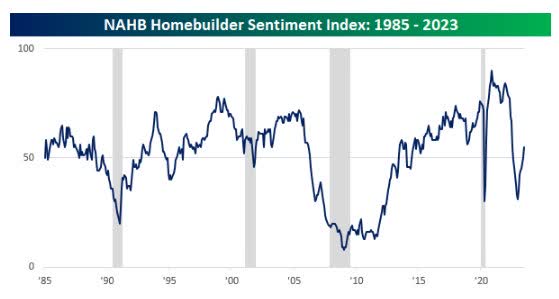
It is also interesting how sentiment got to the 2020 recession lows, while the back-to-back quarters of negative GDP last year were never called a recession.
Housing starts surged 21.7% to a 1.63 million pace in May, much stronger than expected and the largest increase since 2016, after dropping -2.9% to 1.34 million in April.
Housing Starts (www.tradingeconomics.com)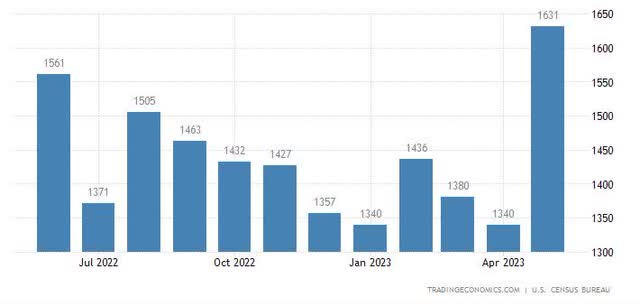
This is the fasted pace of starts since April 2022.
The Global Scene
THE U.K.
The BOE (Bank of England) raised rates by 50 basis points today in response to the continuing problem of high inflation. The main lending rate is now 5%. BoE Governor Andrew Bailey:
The economy is doing better than expected, but inflation is still too high and we’ve got to deal with it. If we don’t raise rates now, it could be worse later.”
UK Inflation is proving to be very stubborn as the May report indicates the rate remains at 8.7%.
CHINA
China cuts lending benchmark rates for the first time in 10 months, as officials discuss more stimulus measures. After the PBoC cut two key interest rates last week, it also lowered the benchmark lending rates today. The one-year loan prime rate, used for corporate and household loans was lower by 10 basis points to 3.55% today, while the five-year rate, a reference for mortgages, was dropped to 4.2% from 4.3%. The Chinese cabinet reportedly met last Friday to discuss measures to support the recovery, but rate cuts aside, nothing has been confirmed yet.
We’ve seen how the much-awaited China “re-opening” has turned out to be a bust. Goldman Sachs jumps on that bandwagon and cuts China’s 2023 growth forecast from 6% to 5.4%. They also lowered their 2024 growth forecast from 4.6% to 4.5%.
PMIs
Global PMIs were lower in May, indicating the rebound may have stalled.
U.K
Composite Output Index at 52.8 (May: 54.0). 3-month low.
Services PMI Business Activity Index at 53.7 (May: 55.2). 3-month low.
Manufacturing Output Index at 47.7 (May: 47.7). Unchanged.
Manufacturing PMI(4) at 46.2 (May: 47.1). 6-month low
EUROZONE
Composite PMI Output Index at 50.3 (May: 52.8). 5-month low.
Services PMI Business Activity Index at 52.4 (May: 55.1). 5-month low.
Manufacturing PMI Output Index at 44.6 (May: 46.4). 8-month low.
Manufacturing PMI at 43.6 (May: 44.8). 37-month low.
JAPAN
Composite Output Index, June: 52.3 (May Final: 54.3)
Services Business Activity Index, June: 54.2 (May Final: 55.9)
Manufacturing Output Index, June: 48.4 (May Final: 50.9)
FOOD FOR THOUGHT
The “Climate Bill” (aka Inflation Reduction Act) that was signed into law last August will wind up being another costly adventure that continued the spending spree. That legislation earmarked another 369 billion for climate control.
Global Emissions (www.statista.com/)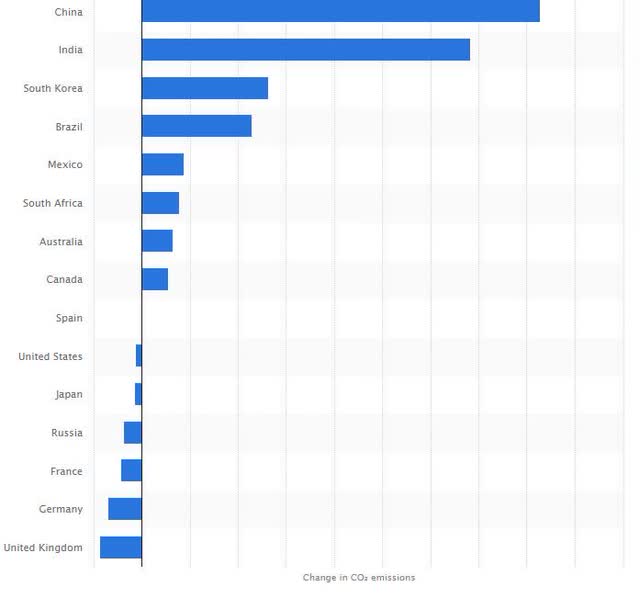
In the period from 1990 to 2021, the U.S. has reduced its emissions by 6%. In contrast, China and India have seen hundreds of millions of people emerge from energy poverty, and their emissions increased by 413% and 341% respectively. That growth trend will continue.
The Los Angeles Times recognized the defects in the green new deal and wrote about it back in 2019, well before the oversized spending on this issue began.
Although global warming may present long-term challenges, it’s not an immediate crisis, despite the dire warnings of politicized scientists. The rate of warming over the past 40 years has been modest, and the demonstrable impacts have been mild. The experts predicting doom ignore the data and rely on discredited computer models.
What would cause a real, immediate crisis is for Congress to enact the back-to-the-Dark-Ages policies of the Green New Deal.”
Unfortunately, the rhetoric and associated mindset is that the US plays a large part in the world’s emission problems, despite the statistics proving otherwise. We are well on our way to Trillions in spending at a time when debt is already at record levels. The handwriting has been on the wall for a while. Because of all of the other factors, the associated costs are going to far outweigh the benefits. The final result will be a negligible effect on the global emission issue while causing a tremendous amount of economic pain.
It’s time to read that handwriting.
The EV TRANSITION
This missive highlights what I’ve been warning about for a while, “Ford Just Shoved ‘All In'”.
ALL of the decisions circling the climate change drain, from curtailing fossil fuel production to car companies disdaining a moderate transition to electrification will have MAJOR implications for the economy. Enter the Federal government with low-cost loans that put taxpayers on the hook for what is currently a losing proposition. We can’t dismiss the fact that currently, the company is losing money on the entire EV transition. They join a long list of other EV makers that are burning money at a rapid rate and may never be around to see profitability. The probability that this doesn’t end well is VERY high.
When there is no negligible change to air quality by 2030 and beyond, people are going to be saying “What were they thinking?”
The Daily Chart of the S&P 500 (SPY)
We got our first look at a pullback this week as the S&P 500 grudgingly gave back a small portion of its recent gains.
S&P 500 (www.tc2000.com)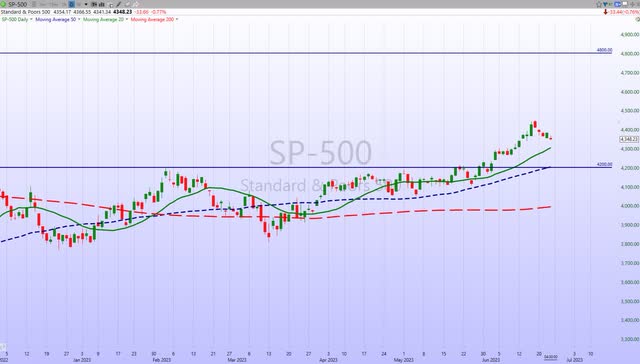
Support looms at the rising trend line. That’s about another 1% from Friday’s close, and if that holds, the pullback will be very shallow. The next support comes in around S&P 4200, and that would add 3+% to this drawdown. That would be more in line with a “normal” corrective phase that still leaves the BULLS in control.
INVESTMENT BACKDROP
F.I.N.E – My acronym for the present mindset of the average money manager and many investors – Frustrated, Insecure, Neurotic, and Emotional.
There is little need to re-hash all of the stats, graphics, and charts that tell us how overbought and extended the equity indices have become. We’ve covered them all. While we spoke about the possibility of a rally that could take the S&P up to the 4300 range not many expected what has occurred this month.
Once the S&P pushed higher, and took out the August highs (4305) the stampede was on. That kicked off “short” covering, and turned the BUY program switch ON, which kicked in more algorithmic and FOMO buying. As the S&P 500 was nearing the top of the 4200-4400 region I (along with many others) have been eyeing for months, it sure appeared to be the perfect setup for a pullback. We saw the first bout of MILD weakness enter the scene this week.
So what happens now? The S&P did push to 4448 on an intraday basis and some started to suggest the indices were about to board Ozzy Osbourne’s “Crazy Train” and eventually go off the rails. It did feel like typical “Blow-Off” price action and now we’ve seen the S&P reverse and close below 4400. Normally I’d stick my neck out and proclaim that was the intermediate top, but with this momentum and euphoria, any short-term analysis now is simply guessing.
With the S&P very extended and just beyond the limits of what I thought probable, we are sort of flying blind at the moment. So far, any intraday dips look “corrective” rather than impulsive to the downside. Intraday support has held as well. That infers the BULLS can revisit the scene and make another run at higher highs despite what remains an overbought scene. It is worth noting the divergences that are still present.
BIFURCATED MARKET
The S&P 500, NASDAQ Composite, and NASDAQ 100 made 52-week highs but more importantly they have closed above their Longer term trend lines. In the case of the Tech indices, they confirmed the breakout last month with yet another strong month. The S&P barely accomplished that feat in May, but this month isn’t leaving any doubt that it’s also trying to confirm a change in trend.
However, Dow Theorists will tell us there is no “all clear” signal just yet. The Industrials remain below both their November and February highs, while the Transports remain below their February and even April highs. This non-confirmation can be remedied, but for now, it’s a factor weighing against the “new bull market” views. Then again it is not a matter of what anyone wants to call this. I’m just trying to navigate the situation that is directly in front of me.
SMALL CAPS
The small caps as measured by IWM add another “non-confirmation” that needs to show more strength to help confirm the upside. IWM has put in a series of LOWER highs since the BEAR market began last year. There is no definition out there that can spin that into a BULL market backdrop.
SECTORS
CONSUMER DISCRETIONARY
The sector (XLY) remains an outperformer this year with Amazon (AMZN), +3% this week, leading the way.
ENERGY
The Energy ETF (XLE) isn’t participating in this surge but is holding together relatively well. With the long-term trend still intact, it is a sector that deserves a look.
FINANCIALS
The banking sector (XLF) has historically been viewed as a lower beta asset class and tends to perform in line with broader economic cycles. However, since the onset of the pandemic, the sector has debunked this theme and become much more volatile. In turn, with significant uncertainty on the broader economy and the cyclicality of the banking sector, in general, investors have remained underweight the sector heading into the new year. That has been a good strategy since the sector (-4.2% YTD) has lagged behind the S&P (+13%) and remains in a Long Term BEAR market trend all year.
Following the recent bank failures investors rushed to the exits, further increased underweights. As highlighted recently sentiment remains very weak, and it doesn’t seem like Portfolio Managers expect to increase sector weightings until visibility improves on several fronts.
HEALTHCARE
The underlying internals of the Health Care ETF (XLY) differ from the other sectors in that there is more underlying strength being displayed than is showing up in prices. The sector always provides a nice balance to every portfolio, and I advise accumulating on weaknesses.
BIOTECH (sub-sector)
The Biotech sector (XBI) is making another run at the ’23 highs and in doing so has ticked above the longer-term trendline as well. That has been a resistance range that capped the sector since November 2021. I continue to play specific situations within the group while looking for other opportunities in a sub-sector that I expect to hold its own for the remainder of this year.
GOLD
The Gold ETF (GLD) was looking rather scary and when support didn’t hold, the metal drifted lower and is now on its way to the lower end of the near-term trading range.
SILVER
The Silver ETF (SLV) followed a similar path as Gold this week and is already down at a support level which has me interested in adding back the portion of the position that was sold at the open on Tuesday.
URANIUM
Uranium (URA) gained some traction during this market rally and met resistance in the $24 range. After giving it some thought, I avoided being greedy and sold the shares I recently added in March, taking the 24%-25% gain. Similar to the SLV position, I’ll keep the original shares as a CORE holding.
TECHNOLOGY
Semiconductors Sub-Sector
For the moment the AI fever has been broken. The Semiconductor ETF (SOXX) grudgingly gave back ~5% this week and has now broken first support. Given the enormous run, this recent activity is hardly a dent in the gains for the year.
No doubt Semiconductors have helped to lead the way recently (thanks in large part to NVDA and AI optimism). We’ll know rather quickly if the semis will re-energize here and continue this surge or simply drift lower and settle into a sideways trend. Unless we see a quick rebound early next week, I lean to the latter scenario.
FINAL THOUGHTS
This equity market has shown that it is capable of recapturing an important technical level, and if it’s capable of doing that, then it “unlocks” the potential for more gains in the bigger picture. I still think the odds favor getting some sort of retracement soon (it may have started), but in the interim, I’m content with adding stocks that show potential on both the technical and fundamental front and are not overextended.
My primary concern in the bigger picture has been that a reversal around that 4200-4400 region followed by heavy selling would represent a major top that would take us back down to the lower end of the trading range. If this is truly the beginning of a new BULL trend there will be an abundance of opportunity offered. However, there is also this fact to consider. While we’ve seen new highs and a BEAR market low, the S&P is trading at the same level it was in June ’21. That is two years of zero performance, leaving an investor to contemplate the no-risk returns that are being offered today.
Short-term trading requires discipline, flexibility, risk management, and an open mind. Long-term investing requires patience, flexibility, and humility. Practiced together they make for the “perfect investor”.
When we stumble and make mistakes, don’t be discouraged, the “perfect investor” is yet to be found.
THANKS to all of the readers that contribute to this forum to make these articles a better experience for everyone.
Best of Luck to Everyone!
Read the full article here


