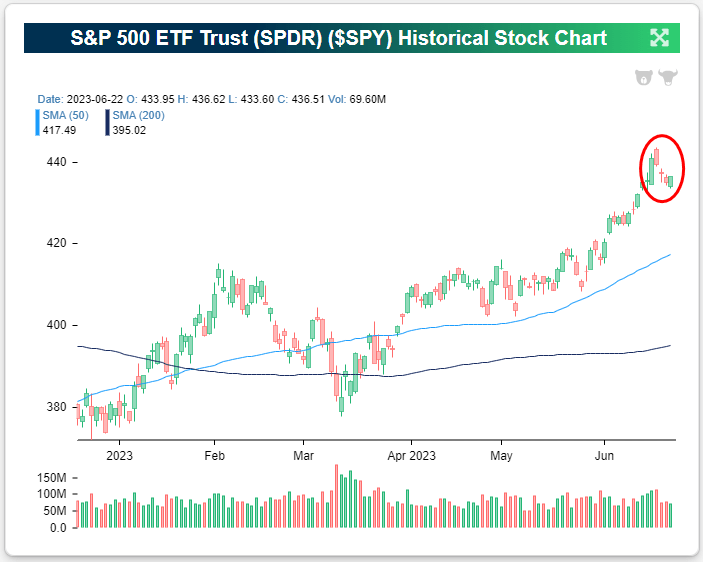
The S&P 500 (SPY) has pulled back about 2.2% since its high close for the year on June 15th, but as you can see below, the decline only brings us back to where we were trading early last week. The market is still trading well above both its 50-day moving average and its 200-day moving average.

Normally you’d expect to see the stocks that gained the most during the rally also pull back the most when we see downside mean reversion, but that hasn’t really been the case over the last week.
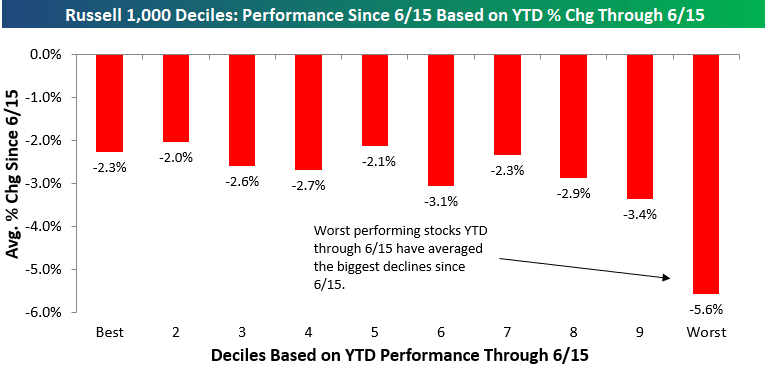
Below, we’ve broken the large-cap Russell 1,000 into deciles (10 groups of 100 stocks each) based on stock performance on a year-to-date basis through June 15th.
Decile one contains the 100 stocks that were up the most YTD on 6/15, and so on and so forth until you get to decile ten which contains the 100 worst-performing stocks YTD through 6/15.
As shown, the decile of stocks that were up the most YTD on 6/15 (last Thursday) are down an average of 2.3% since then. That’s actually better than the average decline of 2.9% seen across all stocks in the Russell 1,000 since 6/15.
Where the weakness has been since last Thursday has been in the stocks that were already performing the worst in 2023 up to that point. The stocks in the decile of the worst performers YTD through 6/15 are down an average of 5.6% since then.

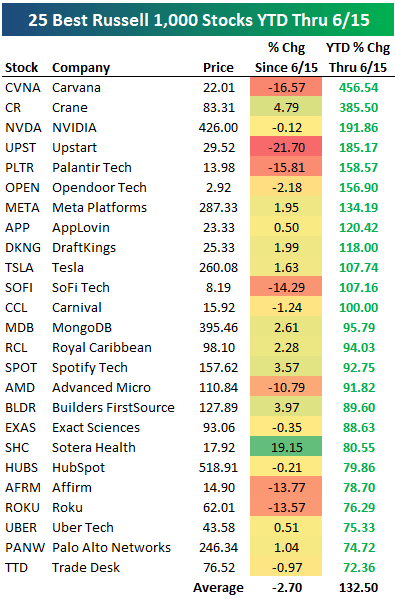
Below is a look at the 25 stocks in the Russell 1,000 that were up the most YTD through 6/15 when the market made its recent high. Some of these names have pulled back 10-20%, but plenty of names have also continued to rally as well, and the average change across all of them is a decline of 2.7%.

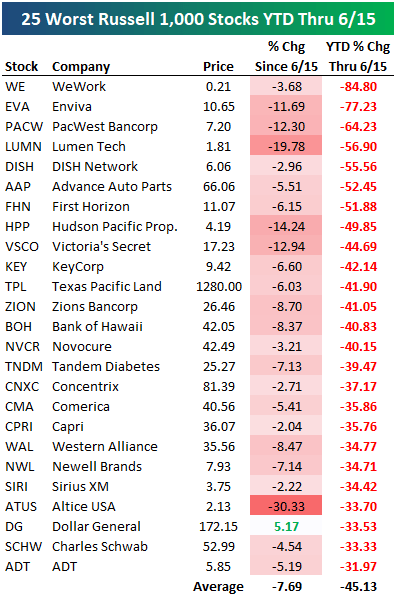
On the flip side, just one of the 25 stocks that were down the most YTD through 6/15 is up since then, while the average change for these 25 names since 6/15 is a decline of 7.7%.

Original Post
Editor’s Note: The summary bullets for this article were chosen by Seeking Alpha editors.
Read the full article here


