Thesis
The iShares High Yield Bond Factor ETF (BATS:HYDB) is an exchange traded fund. The vehicle comes from the BlackRock family, and seeks to track the results of an index composed of U.S. dollar-denominated, high yield corporate bonds, namely the BlackRock High Yield Defensive Bond Index. The purpose of the said index is to sift through the universe of high yield bonds and pick the ones with better risk/reward metrics based on a set of analytical tools:
The objective of the BlackRock High Yield Defensive Bond Index is to provide enhanced risk-adjusted returns relative to the comparable capitalization-weighted Indices for the U.S. high yield corporate bond market. The investment thesis underpinning these strategies is based on the premise that many fixed income investors reach for yield, driving up the prices of riskier bonds. Investor demand for higher yielding bonds may result in a mispricing of credit risk, whereby bonds associated with lower credit quality may be overpriced relative to similarly rated bonds associated with higher credit quality. Indices that avoid bonds issued by the riskiest issuers may produce higher risk-adjusted returns than those that include bonds from the riskiest issuers. By introducing value as a diversifying factor, the Indices may provide opportunities for higher yield and improved total return versus market capitalization weighted Indices.
To translate the above in English, BlackRock came with a set of analytical tools that it employs in order to ‘screen’ the HY bond universe for outperformers via the BlackRock High Yield Defensive Bond Index composition. Instead of just buying the HY market via funds such as the iShares iBoxx $ High Yield Corporate Bond ETF (HYG) or the SPDR Bloomberg High Yield Bond ETF (JNK), BlackRock aims to capture investors looking for ‘smart beta’ via HYDB which tracks the BlackRock High Yield Defensive Bond Index.
As a reminder, a retail investor cannot purchase an Index. A retail investor can only obtain the returns of an index via an exchange traded product such as an ETF, an ETN or a CEF. HYDB is the exchange traded retail tool to access the returns of the BlackRock High Yield Defensive Bond Index. Also given this is a BlackRock index, one will not have outside ETFs tracking this index since large fund families use them to generate fund flows and AUMs. HYDB is the only exchange traded instrument that offers the return profile of the BlackRock High Yield Defensive Bond Index. In this article we are going to use HYDB and the Index interchangeably.
Analytics and ‘Smart Beta’ Analysis
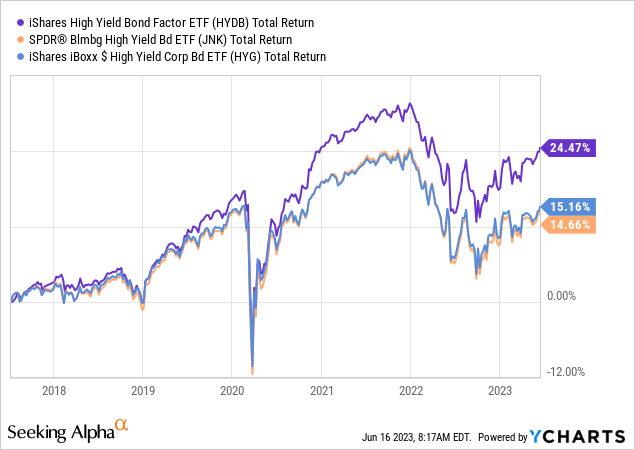
From a performance stand-point, ‘the proof is in the pudding’:

Usually over long periods of time, ‘smart beta’ strategies will eventually show the veracity of the assumptions/strategies behind the build. In this case HYDB delivers, especially during lower rates environments. We can see how the fund outperformed JNK and HYG by significant levels during 2020-2022.
Investment managers will try to layer in a significant amount of complexity and analytics in some of their funds, only to look smart in many instances. Just utilize a very simple rule of thumb – simpler is better, and a complex product needs to outperform in order to prove its weight.
One of the main variables utilized by the Index to identify undervalued bonds is the market based probability of default (“PD”). The PD estimate is primarily determined by a company’s financial health, industry characteristics, and market environment. The model inputs utilized in this instance are accounting data, market data of equity and bond instruments, bond ratings, and other economic variables. The issuers with the highest PDs are eliminated from the cohort, and an optimization is used to maximize the aggregate default adjusted spread score while mitigating common factor exposures, specific risks.
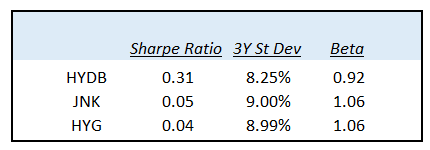
HYDB has the analytics to back up its historic outperformance:
Analytics (Author)
A retail investor always needs to look at analytics. They are the underlying tools that can serve as an uniformization of performance. The most important ratio to consider is the Sharpe Ratio:
The Sharpe ratio divides a portfolio’s excess returns by a measure of its volatility to assess risk-adjusted performance. Excess returns are those above an industry benchmark or the risk-free rate of return
The higher the Sharpe ratio the better. Just because an investment has a higher yield does not make it better. An investment can have a low yield but virtually no risk, thus making it more attractive on a risk/reward basis. This is exactly what HYDB is trying to capture via its bond selection. And it seems it is succeeding. The fund has the best Sharpe ratio from the cohort and the lowest standard deviation.
The standard deviation is a measure of volatility, thus an investor will always want a lower one per the same unit of yield. Beta is also a measurement of volatility, this time around when compared to the underlying market, which in this case is the U.S. high yield bond market.
HYDB via its analytics and performance shows that it does what it is supposed to do – its tools do indeed identify undervalued HY bonds, and its strategy has managed to deliver higher historic alpha for the same unit of risk. HYDB is a superior product to JNK and HYG, although it does not have the same liquidity.
Holdings
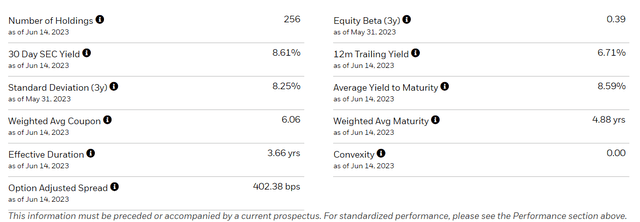
The fund has only 256 holdings as of the writing of this article, versus more than 1100 for HYG:
Details (Fund Website)
Keep in mind, the fund is trying to identify the bonds with better risk/reward factors, rather than take a sample of the entire HY bond universe. The fund does not take excessive duration risk, having a 3.66 yrs duration versus 3.7 yrs for HYG. There is virtually no difference there, so no additional risk via duration increases.
The fund does not take incremental credit risk either:
Ratings (Author / Fund Fact Sheet)
We are comparing here side by side HYDB and HYG. We can see both funds with a rough 50% ‘BB’ composition, but HYG actually contains more credit risky names, with higher ‘CCC’ and ‘CC’ names.
From a holdings perspective we can see HYDB does truly just select credits that it thinks are better, rather than take incremental duration or credit risk. That is a big positive.
Risk Factors
Ultimately HYDB is a U.S. high yield fund. Albeit unleveraged and more defensive than JNK, HYDB will lose value when credit spreads widen again. We believe rates have peaked, and the Fed is done raising rates. That should keep a lid on the risk free rates portion of pricing a high yield bond. However credit spreads have tightened, and with the market in risk-on mode there is ample space for them to spike again in the future.
Conclusion
HYDB is an exchange traded fund. The vehicle comes from BlackRock, and aims to sift through the universe of high yield bonds and pick the ones with better risk/reward metrics in order to invest in undervalued names. Instead of just replicating the U.S. HY bond universe, the fund aims to have a more defensive build via undervalued names which will have less of a downside and a higher upside overall. Upon close inspection, the fund does not take more duration risk or credit risk, thus being true to its objective. HYDB does outperform HYG and JNK on long time-frames, proving its worth and soundness of its analytical framework. We find HYDB to be a superior product to HYG and JNK, offering better risk/reward metrics and returns. With the CNN “Fear and Greed Index” at 82, “Extreme Greed”, this is not a good time to buy high yield, even if defensive. We are looking to Hold here and increase the positioning during the next market drawdown.
Read the full article here


