By Ryan Giannotto, CFA Manager of Equity Index Research
For investors new to the crypto ecosystem, the natural impulse is to try to visualize digital assets within a framework of well-known and familiar investments – we understand what is novel in terms of what we know. To help investors break the digital ice, our task is to see which assets best simulate the role and behaviours of cryptocurrencies.
Ultimately no other investment serves as an entirely seamless proxy for crypto, even within the risk-on category of assets. If we expand the mental framework for this question, however, we can see that gold often best analogizes digital assets’ role as a non-correlating, if volatile, investment.
Out of Stock: Crypto Comparisons
Show me your correlations, says the statistician, and I will tell you what you are. There is a prevailing assumption that digital assets behave like growth equities, but as which much received wisdom, this narrative is at odds with empirical data.
The key factor is that for all their volatility, digital assets are remarkably uncorrelated to stock market risk. For instance, Bitcoin (BTC-USD) maintained a daily correlation to the Russell 1000 Index of only 0.231 since the end of 2015; this value means the two assets explain only 5.3% of each other’s returns, an impressively small figure.[1] If the same analysis is run against the Russell 1000 Growth Index, the explanatory power increases to only 5.7%.
Even if we purposely select the stocks with the greatest sensitivity to the digital asset ecosystem, the connection remains tenuous from a quantitative perspective.
The makers of Graphical Processing Units (GPUs) in the semiconductor space are arguably best positioned as stock market proxies for cryptocurrencies, as they manufacture the devices used to mine and power many blockchain platforms.
Indeed, the leading actors in this segment, AMD (AMD) and Nvidia (NVDA), had their stocks priced as low as $2 and $5 in 2015 – each has since witnessed over a 60-fold rally.

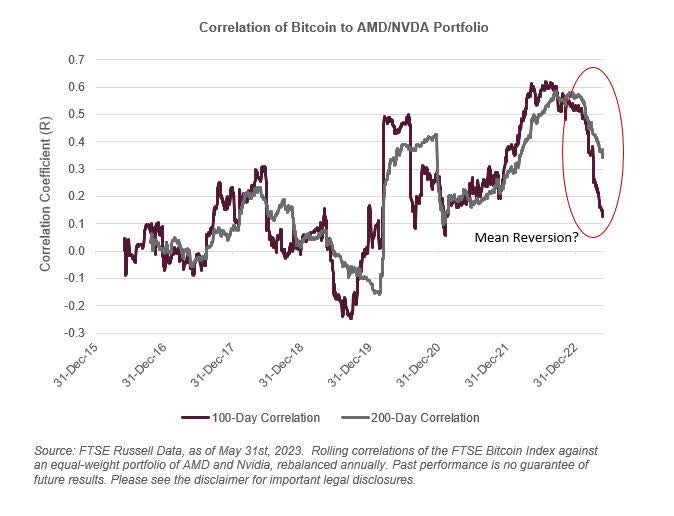
Constructing an equal-weight portfolio of these two companies, rebalanced annually, illustrates just how different cryptocurrency and (modestly) crypto-correlating stocks can be. The figure above depicts the 100 and 200-day rolling correlations between the aforementioned GPU portfolio and Bitcoin since 2015.
Notably, the average correlation over the preceding three years is only 0.253, meaning even the best candidate for a digital asset proxy in the stock market explains only 6.5% of crypto returns, an insignificant sum.
At the height of the 2022 H1 drawdown, the 100-day correlation between Bitcoin and the GPU portfolio peaked at 0.620. This figure is certainly elevated, but it remains somewhat unremarkable given the depth of the sell programs that were pervading all asset classes at the time.
A total of 63% of returns are attributable to other risk factors; even in the most favourable possible circumstances, the potential for crypto-proxy behaviour is limited indeed.

Moreover, this period of higher correlation should be viewed as a deviation from long-run patterns, and not as a typifying trend. In 2023, the rolling correlations are rapidly approaching long-term averages, and indeed the 50-day correlation stood at 0.07 as of May 31st.
Hence, in a period of profound market stress, digital asset correlations only resembled the very closest stocks as much as utilities historically correlate to broad equities, which is to say they trade quite distinctly.
Another challenge arises in that these stocks only became crypto-correlating, and subject to meteoric rise, after the emergence of digital assets – it is a classic causation problem.
Investors therefore cannot examine AMD and Nvidia in the early 2000s and draw inferences of how digital assets might have behaved in such a period. The truth is that no equity serves as an analogue for digital assets, either pre or post the crypto big bang, because stocks and digital assets do not behave like one another.
What is the Right Digital Benchmark?
If under the most conducive of circumstances possible, stocks do not parallel digital asset performance, where else can investors turn for a benchmark? Other alternative currencies, namely gold, best serve as substitutes for cryptocurrencies in terms of store of value, medium of exchange and non-correlative properties.
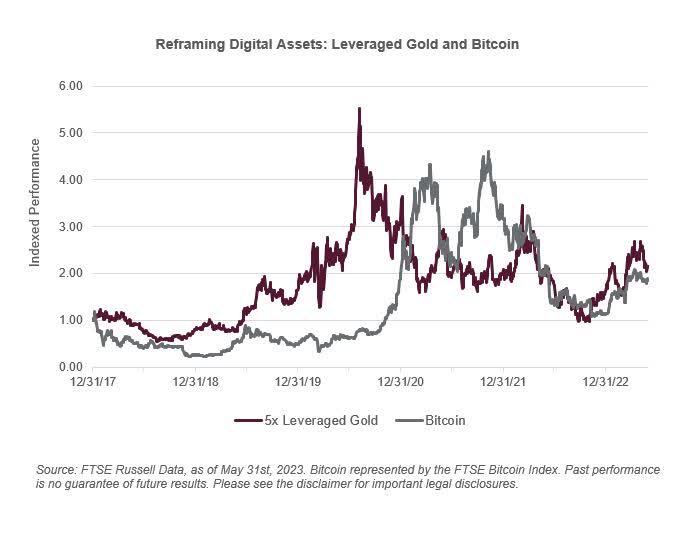
Gold has demonstrated idiosyncratic returns and long-term gains since 1971; amplifying gold’s daily returns by 400% (the vol differential between gold and Bitcoin) and it could be easily mistaken for a digital asset. This assertion does not imply that gold and bitcoin model each other’s behaviour, merely that they are both in a non-correlating class of assets.
Moreover, some of the PGMs (Platinum Group Metals) do exhibit crypto-level volatility and trading patterns – palladium achieved 49% annualized volatility over the last year, and rhodium 215% volatility over the last 20 years.
Indeed, these more exotic metals may be representative of the broader basket of digital assets now available to investors. While not stocks, gold, palladium and rhodium – for the moment – are proving the best assets to contextualize digital asset performance and their diversifying role in the portfolio.
[1] All analyses are as of May 31st, 2023.
© 2023 London Stock Exchange Group plc and its applicable group undertakings (the “LSE Group”). The LSE Group includes (1) FTSE International Limited (“FTSE”), (2) Frank Russell Company (“Russell”), (3) FTSE Global Debt Capital Markets Inc. and FTSE Global Debt Capital Markets Limited (together, “FTSE Canada”), (4) FTSE Fixed Income Europe Limited (“FTSE FI Europe”), (5) FTSE Fixed Income LLC (“FTSE FI”), (6) The Yield Book Inc (“YB”) and (7) Beyond Ratings S.A.S. (“BR”). All rights reserved.
FTSE Russell® is a trading name of FTSE, Russell, FTSE Canada, FTSE FI, FTSE FI Europe, YB and BR. “FTSE®”, “Russell®”, “FTSE Russell®”, “FTSE4Good®”, “ICB®”, “The Yield Book®”, “Beyond Ratings®” and all other trademarks and service marks used herein (whether registered or unregistered) are trademarks and/or service marks owned or licensed by the applicable member of the LSE Group or their respective licensors and are owned, or used under licence, by FTSE, Russell, FTSE Canada, FTSE FI, FTSE FI Europe, YB or BR. FTSE International Limited is authorised and regulated by the Financial Conduct Authority as a benchmark administrator.
All information is provided for information purposes only. All information and data contained in this publication is obtained by the LSE Group, from sources believed by it to be accurate and reliable. Because of the possibility of human and mechanical error as well as other factors, however, such information and data is provided “as is” without warranty of any kind. No member of the LSE Group nor their respective directors, officers, employees, partners or licensors make any claim, prediction, warranty or representation whatsoever, expressly or impliedly, either as to the accuracy, timeliness, completeness, merchantability of any information or of results to be obtained from the use of FTSE Russell products, including but not limited to indexes, data and analytics, or the fitness or suitability of the FTSE Russell products for any particular purpose to which they might be put. Any representation of historical data accessible through FTSE Russell products is provided for information purposes only and is not a reliable indicator of future performance.
No responsibility or liability can be accepted by any member of the LSE Group nor their respective directors, officers, employees, partners or licensors for (A) any loss or damage in whole or in part caused by, resulting from, or relating to any error (negligent or otherwise) or other circumstance involved in procuring, collecting, compiling, interpreting, analysing, editing, transcribing, transmitting, communicating or delivering any such information or data or from use of this document or links to this document or (B) any direct, indirect, special, consequential or incidental damages whatsoever, even if any member of the LSE Group is advised in advance of the possibility of such damages, resulting from the use of, or inability to use, such information.
No member of the LSE Group nor their respective directors, officers, employees, partners or licensors provide investment advice and nothing in this document should be taken as constituting financial or investment advice. No member of the LSE Group nor their respective directors, officers, employees, partners or licensors make any representation regarding the advisability of investing in any asset or whether such investment creates any legal or compliance risks for the investor. A decision to invest in any such asset should not be made in reliance on any information herein. Indexes cannot be invested in directly. Inclusion of an asset in an index is not a recommendation to buy, sell or hold that asset nor confirmation that any particular investor may lawfully buy, sell or hold the asset or an index containing the asset. The general information contained in this publication should not be acted upon without obtaining specific legal, tax, and investment advice from a licensed professional.
Past performance is no guarantee of future results. Charts and graphs are provided for illustrative purposes only. Index returns shown may not represent the results of the actual trading of investable assets. Certain returns shown may reflect back-tested performance. All performance presented prior to the index inception date is back-tested performance. Back-tested performance is not actual performance, but is hypothetical. The back-test calculations are based on the same methodology that was in effect when the index was officially launched. However, back-tested data may reflect the application of the index methodology with the benefit of hindsight, and the historic calculations of an index may change from month to month based on revisions to the underlying economic data used in the calculation of the index.
This document may contain forward-looking assessments. These are based upon a number of assumptions concerning future conditions that ultimately may prove to be inaccurate. Such forward-looking assessments are subject to risks and uncertainties and may be affected by various factors that may cause actual results to differ materially. No member of the LSE Group nor their licensors assume any duty to and do not undertake to update forward-looking assessments.
No part of this information may be reproduced, stored in a retrieval system or transmitted in any form or by any means, electronic, mechanical, photocopying, recording or otherwise, without prior written permission of the applicable member of the LSE Group. Use and distribution of the LSE Group data requires a licence from FTSE, Russell, FTSE Canada, FTSE FI, FTSE FI Europe, YB, BR and/or their respective licensors.
Original Post
Editor’s Note: The summary bullets for this article were chosen by Seeking Alpha editors.
Read the full article here


