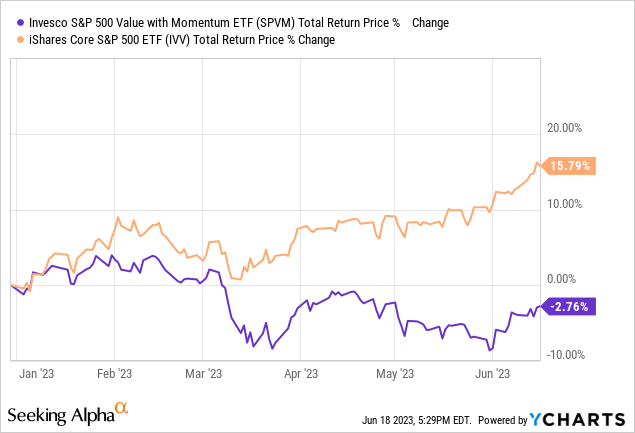
With the chain of ten consecutive rate increases now broken and the Fed assessing the effects of the tightening already done (obviously, not all its consequences are immediately visible yet), it is tough to recommend value stocks over currently trending styles like quality-agnostic growth or momentum as some growth names have yielded cyclopean gains this year, while value is not performing as strongly as in 2022 compared to the market.
However, it does not mean this factor should be forgotten entirely, especially for investors positioning for the long term. And today, I would like to continue reviewing exchange-traded funds focusing on inexpensive companies with a note on the Invesco S&P 500 Value with Momentum ETF (NYSEARCA:SPVM).
What SPVM does and what it does not
Incepted in June 2011, the ETF has seen a few strategy recalibrations. According to the fact sheet, in May 2015, it stopped tracking the RAFI Fundamental Large Value Index and replaced it with the Russell Top 200 Pure Value Index, which was the basis of its strategy until June 2019 when it was replaced with the S&P 500 High Momentum Value Index. Because of these changes, I will ignore its performance prior to July 2019.
Instead of simply chasing cheap stocks, the fund focuses on inexpensive stories that have already been appreciated by the market. Featuring a value score-driven weighting schema, the current benchmark represents a 100-strong cohort of the S&P 500 stocks selected using the two-step process described in the prospectus. First, using the value score (based on Book/Price, Earnings/Price, and Sales/Price), the universe is whittled down to the 200 most attractively priced names. From that pool, 100 companies sporting the strongest positive momentum scores are selected and weighted using the value score, with rebalancing in June and December.
The major premise of this strategy, as I would like to put it, is “when value is in the limelight, it should continue performing strongly going forward.” Of course, precisely like in the case of any momentum-centered approach, investors are exposed to the risk of a rude awakening when a rally ends abruptly, or a phenomenon I described as “momentum shines until it does not” in the article on the iShares Edge MSCI USA Momentum Factor ETF (MTUM). However, I believe racy value stocks are not that exposed to the steep drawdowns compared to their growthier peers thanks to their margin of safety due to inherently smaller growth premia, so it should be safer to deploy the momentum factor in the inexpensive equity universe rather than chase hot stories in overhyped, exorbitantly priced, quality-agnostic space.
What SPVM does not do is that it hardly pays attention to existing valuation differences observed between sectors and industries. This is a principal downside, in theory making the SPVM-portfolio permanently financials- and energy-heavy.
The SPVM website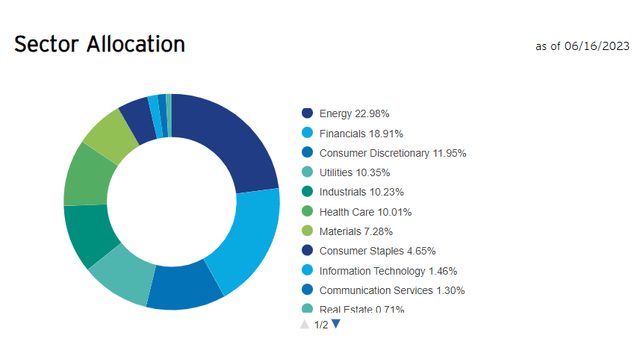
However, as the data from 2020 (saved by the Wayback Machine) suggest, sector proportions could change over time, with momentum being the main reason. More specifically, amid the historic oil price slump, energy equities were hardly capable of competing with other sectors that fared much better, and thus they were only in 9th place in the SPVM portfolio. Nevertheless, banks and the like were still the top allocation back then.
The screenshot from the SPVM website saved by the Wayback Machine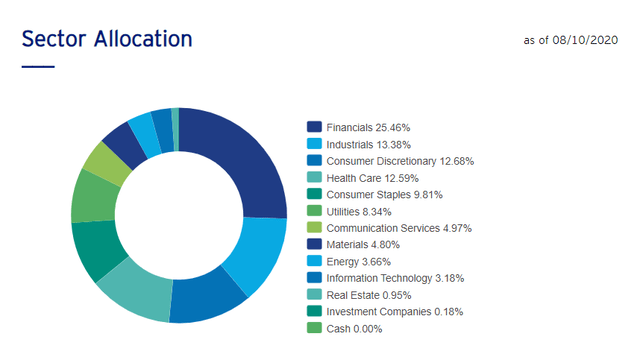
What factor exposure to expect
As of June 16, the fund had a weighted-average market cap of $45.3 billion as per my calculations. This is the primary consequence of its smart-beta weighting. The entire mix has just 7.7% allocated to companies with market values above $100 billion, none of which is in the top ten group (20.3% of net assets). Exxon Mobil (XOM), the energy supermajor, is the most expensive company in the portfolio (1.1% weight), valued at ~$428 billion.
In this regard, it is hardly surprising SPVM has an earnings yield of ~9.5%, which is more than 2x higher than the iShares Core S&P 500 ETF’s (IVV). Besides, stocks with a Quant Valuation rating of B- or higher account for almost 37% of this portfolio, which is not spectacular, but since the ETF is focused on large caps, still a rather strong result.
| EY | Market Cap | P/S | Revenue FWD | EPS FWD | ROE | ROA |
| 9.47% | $45.3 billion | 1.33x | 4.92% | 9.48% | 22.11% | 6.64% |
All the figures are weighted-average; calculated by the author using data from Seeking Alpha
To bring a bit more color, the top twenty contributors to the earnings yield are shown below. Unsurprisingly, almost all these companies operate either in the energy or materials sectors.
Created by the author using data from Seeking Alpha and the fund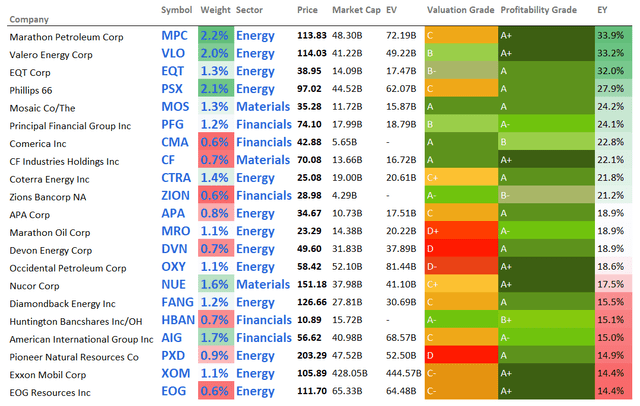
Delving deeper, we see that soft growth is at the root of SPVM’s inexpensiveness. The forward EPS growth rate looks alluring at about 9.5%, but the issue here is that the figure is bolstered predominantly by three energy names, namely two refining players (Marathon Petroleum (MPC) and Valero Energy (VLO)) and the exploration & production company focused on natural gas (EQT Corporation (EQT)). So with their rates reduced to 10% for modeling purposes, the weighted-average figure would be just 6.2%.
Created by the author using data from Seeking Alpha and the fund
Also, the forward revenue growth rate is even less than 5% as only ~4.1% of the holdings are forecast to deliver 20% revenue growth or stronger going forward.
On the positive side, its quality is ample, with almost 91% having Quant Profitability rating of B- or higher. Besides, the ROE/ROA spread looks overall sound, even though a mid-single-digit ROA is unimpressive for my taste.
What performance SPVM delivered in the past
So, was SPVM capable of eliminating traditional value investing flaws (i.e., chronic underperformance)? It made a solid attempt, but ultimately, I would not say that it succeeded.
To illustrate that, I benchmarked its performance over the July 2019 – May 2023 period against a few value ETFs I cover, namely the following.
| 1 | iShares Focused Value Factor ETF (FOVL) |
| 2 | iShares Russell 2000 Value ETF (IWN) |
| 3 | AAM S&P 500 High Dividend Value ETF (SPDV) |
| 4 | Alpha Architect U.S. Quantitative Value ETF (QVAL) |
| 5 | Invesco S&P 500 Pure Value ETF (RPV) |
| 6 | Invesco S&P 500 Enhanced Value ETF (SPVU) |
| 8 | iShares Edge MSCI USA Value Factor ETF (VLUE) |
| 9 | Schwab U.S. Large-Cap Value ETF (SCHV) |
| 10 | SPDR S&P 600 Small Cap Value ETF (SLYV) |
| 11 | iShares Russell 1000 Value ETF (IWD) |
| 12 | Vanguard U.S. Value Factor ETF (VFVA) |
| 13 | iShares Core S&P U.S. Value ETF (IUSV) |
| 14 | iShares S&P 500 Value ETF (IVE) |
| 15 | SPDR Portfolio S&P 500 Value ETF (SPYV) |
| 16 | Fidelity Value Factor ETF (FVAL) |
| 18 | Invesco S&P SmallCap Value with Momentum ETF (XSVM) |
| 19 | Distillate Fundamental Stability & Value ETF (DSTL) |
IVV was added for better context.
Created by the author using data from Portfolio Visualizer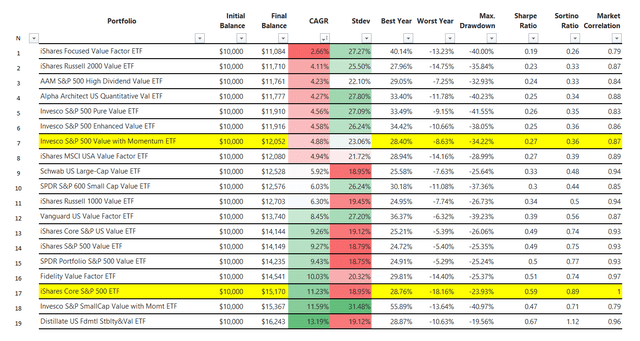
Unfortunately, SPVM was not only incapable of beating IVV, which could have been explained by the fact that value was unable to keep pace with the market’s gains after the March 2020 pandemic-driven sell-off, but it also failed to beat eleven other funds that are mindful of relative valuation, delivering a just 4.88% compound annual growth rate. Interestingly, among the leaders in this cohort is SPVM’s peer also targeting value & momentum, with the difference being the selection universe, the S&P 500 vs. S&P 600.
And this year, SPVM’s holdings are getting the cold shoulder as the market is chasing growth stories again.
Final thoughts
SPVM’s investment strategy is value-centered, with a momentum filter added. It does not target quality names intentionally, but since the S&P 500 is the selection universe, high-profitability companies dominate the portfolio completely. Growth is its Achilles heel, but in fairness, value strategies always have to sacrifice something. Its expense ratio of 39 bps is adequate.
As I said above, the value factor still should be considered even despite the fact investors are now betting confidently on long-duration equities as if the capital shortage era has already ended. The reason is that it is uncertain for how long the higher rates will be percolating into earnings, and whether an earnings recession will be strong enough to result in a value revival and a panic sell-off in the overappreciated echelon.
Nevertheless, I would not say that SPVM is a perfect pick for U.S. value exposure. The first issue is its soft past performance discussed above. The second one is too small AUM of about $38 million. In this regard, it earns only a Hold rating.
Read the full article here


