Summary of investment findings
Further downsides in market value since my last publication on CareMax, Inc. (NASDAQ:CMAX) haven’t done much to change the investment thesis. Last time, I rated the company a hold on a number of uncertainties in its growth outlook. Looking to the company’s latest numbers, its positioning on capital investments, gross profit and expanding the business are still yet to be vindicated, and this has me neutral on the company still.
This report will run through all of the updated investment points in the CMAX hold thesis, with detail on the additional findings. Net-net, there is lack of evidence in fundamental, sentiment, and valuation grounds to suggest the company will attract a higher market valuation in the mid-term despite some improvements in its core unit economics. With these points in mind, I am reiterating the company a hold.
Figure 1. CMAX price evolution since listing in 2020
Data: Updata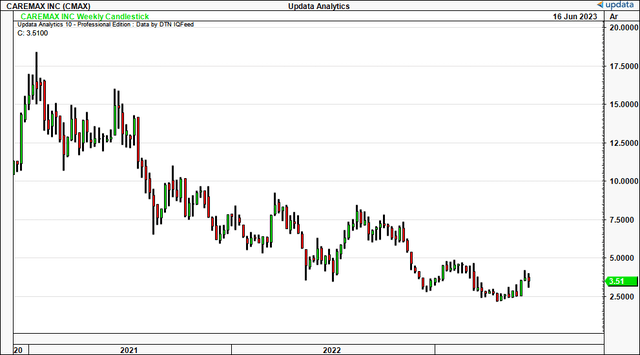
Critical facts forming the hold thesis
The hold thesis is supported with fundamental, sentiment, and valuation factors. I’ll discuss each of these below in more detail, but the major theme is that the company’s growth outlook is quite muted, and investors may have CMAX valued correctly at the current market value.
1. Q1 financials
It’s important to state that CMAX’s operations were impacted by certain headwinds in Q1 FY’23, snipping revenue and adj. EBITDA. Thankfully, these are unlikely to continue. Two factors influenced the results:
- MSL membership – due to one of the health plans.
- Higher acuity admissions in Q4.
These factors, along with the higher medical expense ratio (discussed later) snipped turnover by $25.5mm and pre-tax income by nearly $15mm. Top-line revenue pulled to $173mm following this, 26% YoY increase. Medicare risk revenue reached $122mm, a considerable 13% YoY growth, while Medicaid risk revenue was up 27% to $26mm.
As a major positive, turnover has been climbing at a pace for CMAX since it was listed in 2020, as you’ll see below. Another $557mm in TTM revenue on top of the September quarter 3-years ago.
There are, however, challenges with this. The revenues are hardly profitable. CMAX gives the investor 13% trailing gross margin to work with, 76% below the sector median.
Further, scaling CMAX’s gross profit against its asset growth is equally as telling of the market’s pessimism. For one, growth in operating assets has scaled tremendously the last 2-years, now running at just over $1Bn in capital density at the time of writing, off $33mm 2-years ago.
Second, the gross profitability produced from these assets generated just $0.08-$0.10 on the dollar on each rolling TTM period since 2021. That’s an 8-10% gross return on the company’s (and therefore the investor’s) assets, not even comparable to the market’s return on capital (historically around 10-12%).
Table 1. CMAX revenues, gross profit (TTM figures)
Data: Author, CMAX 10-Q’s
As a result, in my view, there is little chance that CMAX will:
- Have sufficient internal capital to recycle back into the business to fund future growth initiatives, therefore calling on external financing;
- Have scope to focus growing operating earnings or expanding the business operations;
- Create value for shareholders in the medium term.
Alas, it is difficult to get the investment cortex excited with just 8% gross return on capital, notwithstanding the 13% gross margin to try and catch even a drip of income to the operating line.
On this, the company had ~$44mm in cash and c.$95mm of undrawn capacity on its delayed draw term loans at the end of Q1, which should be sufficient runway into FY’24 in my view.
Figure 2.
Data: Author, CMAX 10-Q’s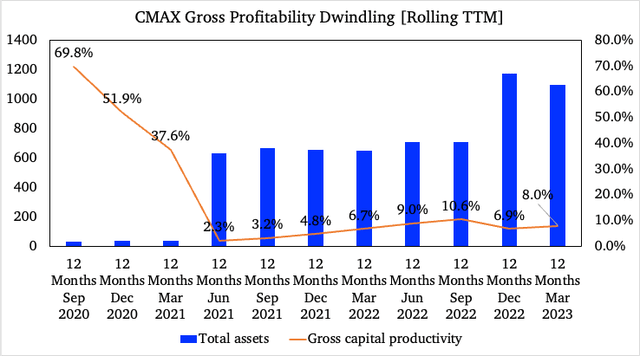
2. Unit economics
To drill down into the underlying performance of CMAX, and ascertain the company’s economic characteristics going forward, one needs to know the ins-and-outs of its Medicare platforms, and the economics of the company’s expense ratios.
- Medicare platforms and revenue:
- The firm booked another period of growth in its Medicare Advantage (“MA”) platform, now claiming 95,500 patient lives on the platform as of Q1.
- Further, it had 107,000 lives on its Medicare Government platform and 33,500 under Medicaid.
- You’re looking at growth of patients from 16,500, zero and 23,000 from Q1 FY’21, respectively.
- Net-net, this represents ~$1.3Bn of revenue under management, well up from 2 years ago.
- The company has made significant progress in transitioning its MA membership to full-risk arrangements. It aims to have all current members in this by FY’26.
Table 2. CMAX value-based lives.
Data: CMAX investor presentation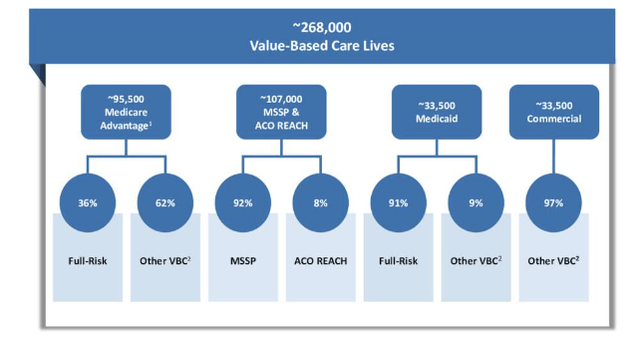
- Medical expense ratio, patient experience:
- Q1 medical expense ratio (“MER”) was 75.2%, higher than the previous year, based on a couple of factors. For one, there is the impact of an earlier-than-normal flu season and elevated cases of respiratory syncytial virus (“RSV”) infections on the cost per admission in Q4.
- Management put a great deal of emphasis on the point these factors aren’t projected to hurt CMAX’s run rate or profitability.
- As a positive, investments the company has made in patient experience look to have yielded some positive outcomes. For example, it reported that its cap survey measured at the 90th percentile among its peer groups in Q1. This isn’t a bad piece of information, actually. Consider this- the company has expanded its network to offer >50 different specialties through its multi-specialty network. That involves many specialty services and niche players. That kind of onboarding of extra business is sure to create some kinks, as growth often does, but these satisfaction measures demonstrate a company that’s focused on its patient outcomes, that’s for sure. You can’t fault that.
3. Lack of positive sentiment
Further to the profitability headwinds above, market sentiment isn’t conducive to a buy rating. For one, there’s been no upside revisions to analyst estimates on revenue or earnings in the last 3-months. Au contraire, there’s been 5 down revisions from sell-side analysts in that time. The Street now projects 16% YoY growth in turnover for FY’23.
Second, the market generated data is telling. Price and technical studies do an excellent job of prescribing to us the market’s sentiment, and what actual market participants (vs. commentators) are doing. Looking to Figure 3, the stock has pushed lower in Q2 FY’23 in continuation of the longer-term downtrend since it first listed. It has made multiple attempts at a breakout above the resistance line shown, but hasn’t nudged through this psychologically important level.
Figure 3.
Data: Updata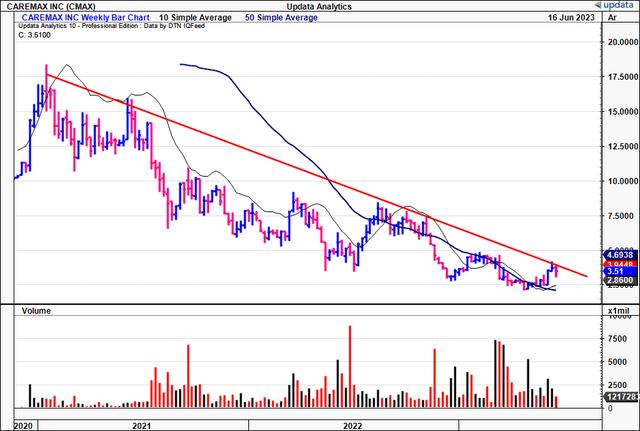
Further, the stock is trading below the cloud on the weekly Ichimoku chart, with the lagging line at equal depth below. This tells me the trend remains neutral at least and a break above $5 is needed by August in order to revert to a bullish stance. Hence, this supports a neutral view.
Figure 4.
Data: Updata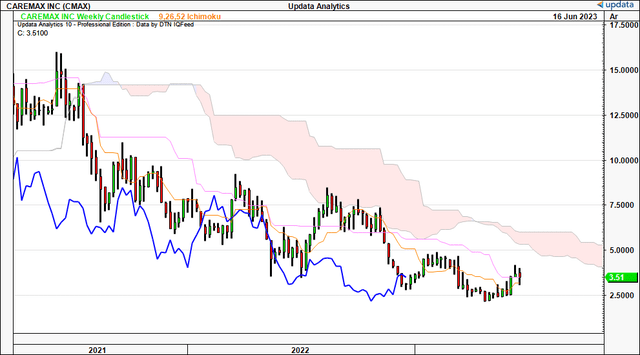
As such, I’ve got downsides from the point and figure studies shown below, with targets to $3.35 which could be met at the current trajectory. You can see the guidance these targets have provided over the last 2-years, adding to their validity. Further, the fact these charts smooth the volatility between trends is a good indication that the recent rally may be just a short-term move within the broader downside move. Next technical target is $3.35 from these studies.
Figure 5.
Data: Updata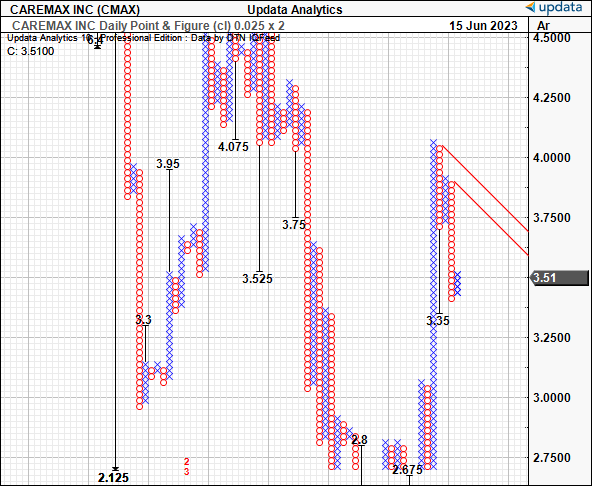
4. Valuation
There is potential relative value in buying CMAX at 0.5x forward sales, nearly 88% discount to the sector multiple. This is rated highly by the quant system, as shown below.
Figure 6.
Data: Seeking Alpha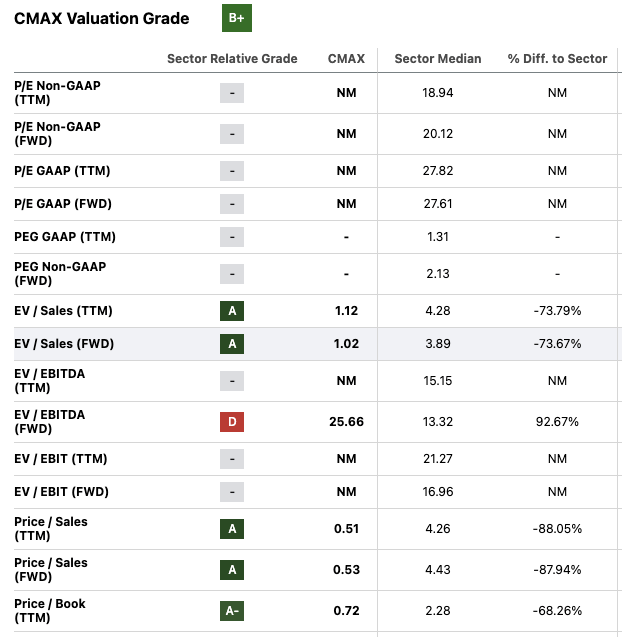
Suspicions immediately arise on the reasons for this compressed figure, however. The market’s expectations have been revised lower since the company listed, each quarter since the IPO. With the latest numbers, I (nor the sell-side from what it seems) haven’t identified anything of substance, any catalyst that would cause a re-rating in the mid-term. This would likely be reflected in sentiment and price anyway, and it’s not, as described earlier.
Not to mention, management project $700-$750mm in top-line revenue for FY’23, another $170mm on FY’22, getting you to $3.37 in value for its stock price at the 0.5x multiple (0.5×750/111 = $3.37). That’s at the upper end of range – consensus, for example, expects $731mm, getting you to $3.30. My estimates are at $730mm for FY’23 as well, hence I am aligned with the consensus view, and therefore don’t spot any mispricings at the current valuation. In that vein, the hold thesis is supported on valuation grounds as well, in my view.
In short
After extensive revision of the investment thesis, the updated findings corroborate that CMAX is not an investment grade company at this stage. Fundamentals, sentiment, and valuation are each lacking in energy, meaning they are unlikely to be catalytic to the company’s stock price in my view. In particular, the market has it valued at 0.5x forward sales, what seems an appropriate 88% discount to the sector. Further, growth is murky going forward, when considering profit and asset factors for the company. Net-net, reiterate hold.
Read the full article here


