Introduction
Sunnova (NYSE:NOVA) is a rapidly expanding Energy as a Service (EaaS) company that currently serves over 279,000 customers across the United States. Founded in 2012, Sunnova’s mission is to provide clean, affordable, and dependable energy solutions for both residential and commercial clients. As the effects of climate change continue to escalate, the significance of renewable energy markets and investment in climate solutions has become increasingly apparent to individuals and governments.
Sunnova financials and business outlook
Sunnova Energy has adopted a dealer business model that gives it an edge over its competitors. By partnering with local dealers who are responsible for the origination, design, and installation of solar energy systems and other products on behalf of NOVA, the company is able to tap into their specialized knowledge and connections in each local market. This helps to reduce fixed costs compared to other players in the industry. Sunnova’s primary focus is on offering solar service agreements in the form of leases, power purchase agreements (PPAs), and loans, with initial terms ranging from 10 to 25 years. While this approach involves significant upfront costs, it also results in high levels of long-term debt for the company. However, Sunnova’s customer base growth would lead to long-term profits. Sunnova’s agreements, which are based on leases and PPAs, offer tax benefits and other incentives from federal, state, and local governments. This would enable them to finance their up-front costs and growth investments through tax equity and hedging arrangements. The Investment Tax Credit (ITC) is a renewable energy tax credit that indirectly subsidizes the investment and production of renewable energies. The ITC provides a credit for expenses invested in renewable properties, and in 2022, the Inflation Reduction Act extended this credit for another ten years until 2032 as a 30% credit for qualified expenditures.
In 2022, Sunnova expanded its customer base by 45%, reached 279,400 customers in 2022 compared to the 192,600 at the end of 2021 (see Figure 1). Despite an average growth rate of approximately 49% in the number of customers from 2018 to 2021, they anticipate increasing this figure to a range of 55% to 59% and achieving around 434,000 to 444,000 customers by the end of 2023.
Figure 1
Sunnova annual report 2022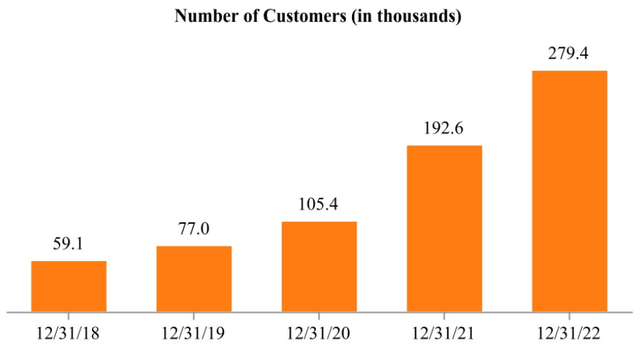
As previously mentioned, Sunnova’s capital structure is a major concern due to their significant debt levels. Specifically, their debt increased by approximately 60% to $5.8 billion in the first quarter of 2023 compared to $3.6 billion in the same quarter of 2022, while their cash balance remained relatively unchanged at $211 million versus $208 million in 1Q 2022. This results in a net debt of over $5.6 billion. Despite an increase of 17% in equity levels to over $1.9 billion in 1Q 2023 from $1.6 billion in 1Q 2022, their debt levels remain significantly higher than both equity and cash levels (see Figure 2).
Figure 2 – NOVA’s capital structure (in millions)
Author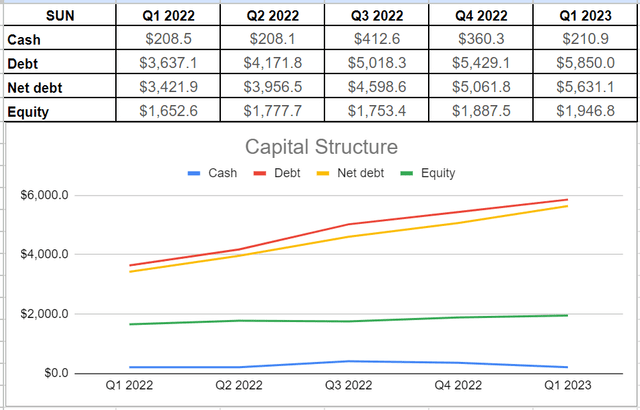
Meanwhile, Sunnova’s revenue for the recent quarter reached $161.7 million, a significant increase from the $65.7 million recorded during the same period in 2022. This growth was largely driven by an increase in the number of solar systems in service and inventory sales to dealers and third parties. A closer look at Sunnova’s cash structure reveals that their capital expenditures for the previous quarter amounted to $272.2 million, which is 17% lower than the $330.4 million spent at the end of 2022 but 11% higher than the $244.5 million spent in Q1 2022. These expenditures were primarily focused on investments in software, services, and multiple channels for growth, which have helped Sunnova increase its market share and expand its reach. However, Sunnova’s operating cash outflow hit a record high of $169.3 million in Q1 2023 compared to its previous four quarters, resulting in negative free cash flows throughout last year. This increase in operating expenses can be attributed to the influx of new customers who have recently signed long-term contracts with the company (see Figure3).
Figure 3 – NOVA’s cash structure (in millions)
Author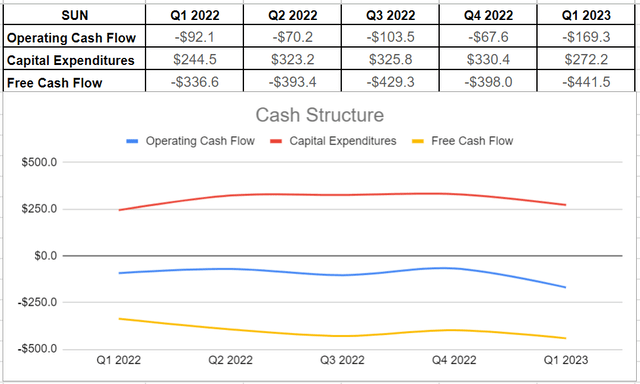
NOVA stock valuation
The EV-to-EBITDA ratio is a useful valuation metric that indicates how much we need to pay for the entire business in terms of EBITDA. Figure 4 shows that Sunnova Energy’s ratio of 65.5x is similar to its peers, except for Sunrun (RUN) and SunPower (SPWR), which have the highest and lowest ratios, respectively. However, Sunnova’s projected increase in Adjusted EBITDA suggests that its EV-to-EBITDA ratio will likely decrease and thus reach around 36x.
Figure 4 – NOVA financial metric vs. its peers
YCharts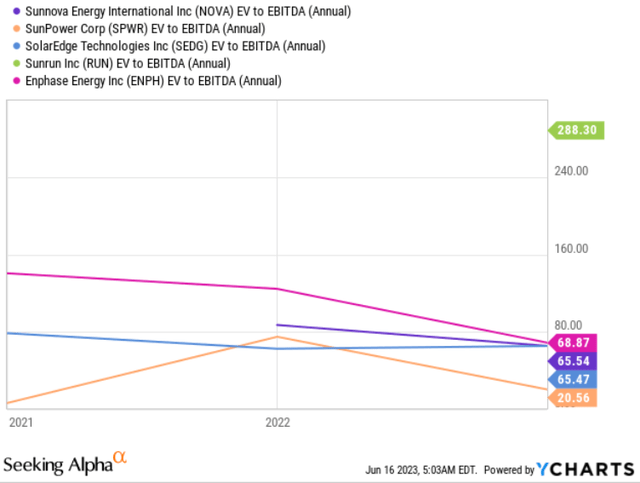
In addition, Sunnova’s EV-to-Revenue metric of 13.8x is higher than the average for its peers at 7x. It is worth noting that SunPower has the lowest EV-to-Revenue amount, which is expected given its age and higher market capitalization (see Figure 5). Sunnova Energy is a rapidly expanding company that operates in a volatile industry. Although their debt levels may raise concerns, it is typical for utility companies, particularly those like Sunnova that enter into long-term contracts and incur significant upfront costs. Thanks to their Energy as a Service business model, Sunnova is projected to generate $500 million in cash flow by the end of 2023 based on their current customer base. Furthermore, they recently announced that the U.S. Department of Energy Loan Programs Office has conditionally committed to guaranteeing 90% of up to $3.3 billion in financing to support new loans originated by Sunnova. Looking ahead, despite currently being an unprofitable company, Sunnova is showing promising signs of growth with an increasing customer base. The renewable energy industry also has a positive market outlook, with growing demand and financial assistance from federal and state governments for the next decade to attract more consumers. According to the EIA’s recent short-term energy outlook, solar energy has become the leading source of generating capacity in the United States this year. This new capacity is expected to result in a 24% increase in U.S. solar generation this summer compared to last year’s summer.
Figure 5 – NOVA financial metric vs. its peers
YCharts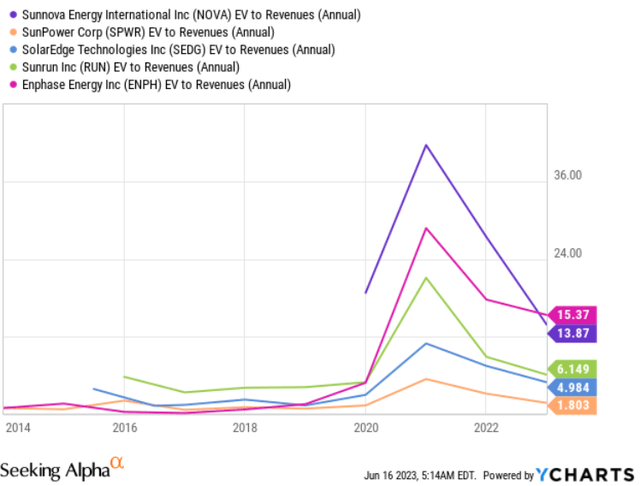
Why I might be wrong
While Sunnova’s core business model aims to accelerate the global transition to renewable energy, it is important to consider the inherent risks associated with their operations. For example, NOVA is a highly volatile and speculative stock, and the company has incurred operating and net losses. Additionally, their high levels of debt may hinder their ability to achieve sustainable profitability in the future. Furthermore, Sunnova’s business model heavily relies on its dealer network, and failure to retain or replace existing dealers or grow a new network could have adverse effects on the company. Sunnova’s management cannot directly control certain costs related to their business, which may put them at a disadvantage compared to peers with vertically integrated models.
Conclusion
Sunnova Energy is currently an unprofitable company with a deep amount of debt levels. However, it is growing its customer base and service technology in an industry that will be financially assisted by the government to attract more demand. It is worth noting that Sunnova’s business model has high initial costs as their contractual agreements with their customers are between 10 to 25 years. When all was said and done, based on the company’s growth and positive outlook for the fiscal year of 2023, I conclude that a buy rating is appropriate for NOVA stock.
As always, I welcome your opinions on this analysis.
Read the full article here


