Investment Summary
A settling macro-landscape, contracting inflation, tight money and an unpredictable Fed don’t set the stage for unprofitable companies to be the next star. For healthcare/med-tech investors, the past 12-18 months have opened up numerous selective opportunities at tremendously attractive prices. In that vein, every security is worth a close inspection, to understand what durable economic characteristics can be bought at a discount.
In December, I extensively reviewed the critical facts for InnovAge Holding Corp. (NASDAQ:INNV) and found it wasn’t an investment-grade company at that point in time, rating it a hold. A recent push in its market price back to previous highs warranted a revisit to this investment thesis. Findings are similar to the December publication in nature, although specific details have changed and must be discussed. This report will outline the revised investment debate for INNV going forward. Net-net, in my informed opinion, INNV remains a hold.
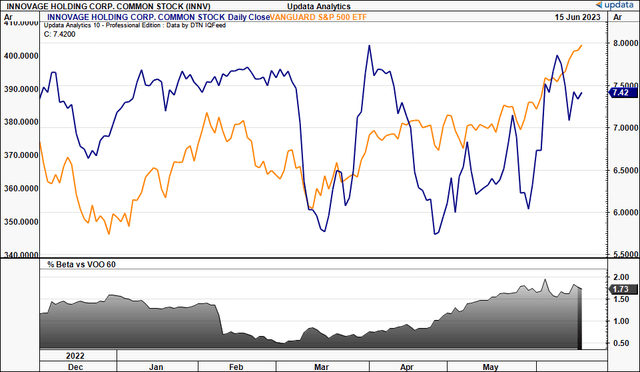
Figure 1. INNV price evolution vs. S&P 500 index
Data: Updata
Key findings forming the hold thesis
Leading into its final quarter for fiscal ’23, the company’s latest numbers do a great job in presenting the potential drivers and compressors going forward. It booked Q3 FY’23 revenue of $172.5mm, a 3% sequential gain on Q2, among a plethora of other results in need of dissection.
Financial results
The company ended the 3rd quarter with about 6,310 participants, and reported centre-level contribution margin of $28.8mm, with a corresponding centre-level contribution margin ratio of 16.7%. In Q3 FY’22, the contribution margin was $22.6mm, so it added another $6.2mm in contribution and overall margin growth of 320bps YoY.
Capitation revenue, at $172.2mm in Q1, was down ~$4.8mm YoY, and hasn’t pulled through to operating earnings since the company listed in 2021 [Table 1]. In fact, as the company’s Q1 revenues have grown $28mm in that time, operating losses have widened by $21mm– not a feature you’d be hoping for in the current climate, not in my view. As such, revenue growth is consuming excessive capital, and management have acknowledged this on the call.
Table 1. Capitation revenue increasing for INNV whilst operating losses deepen. As revenues have grown, so have losses.

Data: Author, INNV SEC Filings
INNV strategically consolidated its Germantown centre in Pennsylvania during the quarter. Efficiency reasons are the basis of this, and it successfully transitioned ~170 participants to its newer, larger centres that are less than 5 miles away. It had to obtain prior approval from CMS and the state before doing this, so the move was done with relative ease, so it seems. This consolidation decreased the total centre count from 18 to 17, which may or may not be a more efficient capital base going forward. We will no doubt see.
Additional takeouts from the quarter, in my view, are as follows:
- The cost of care (“CoC”) increased by 17% compared to Q3 last year. Note, this excludes depreciation and amortization charges, non-cash expenses.
- This rise in prices can be attributed to several key factors. One, salaries, wages, and benefits, accounted for ~80% of the delta. Wages were up due to the company filling critical shortages in labour. Higher wage rates and increased labour costs are also tied to ongoing audit remediation and compliance efforts.
- Two, 3rd-party audit expenditures were up substantially as the company worked through its audits, and performed self-audits in its non-sanctioned markets.
- Three, fleet and contract transportation costs rose secondary to inflationary inputs.
Together, there isn’t much conviction that INNV will grow revenues at rates greater than some of the more profitable names out there right now, let alone the rating it will achieve from the market, in my opinion, as the market is looking to companies who are creating value through a variety of metrics, not just revenue growth alone.
Economic factors
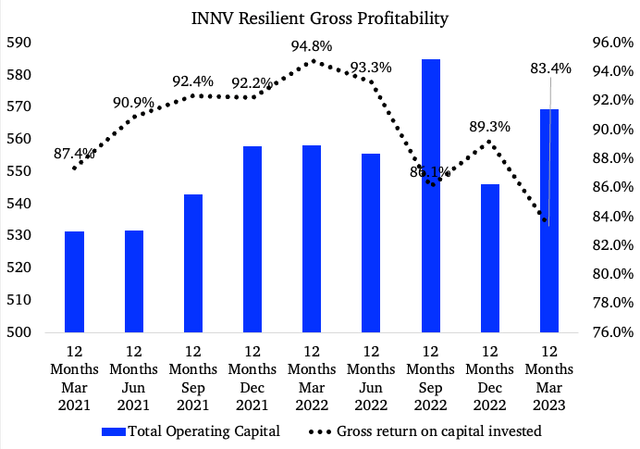
There are balancing factors to the financial results above. Principally, the company is profitable and has the propensity to generate income if it can get the cost situation under control. Measuring gross profitability scaled against asset factors, the company is pushing back $0.83-$0.85 in gross for every $1 in operating capital it has put to work. This, as the capital base has grown over the last 2-years, shown in Figure 2 on a rolling TTM basis.
This is telling. Not only are these attractive numbers, it serves as tremendous base for INNV to continue investing additional capital to grow its top-line. The next challenge is to get its cost structuring under control to pull some income below the operating line, in my opinion. If it does that, the investment picture immediately becomes more attractive, because then it could start attracting investment from more sophisticated accounts who are mandated in investing in profitable names.
Figure 2.
Data: Author, INNV SEC Filings
Technical discoveries
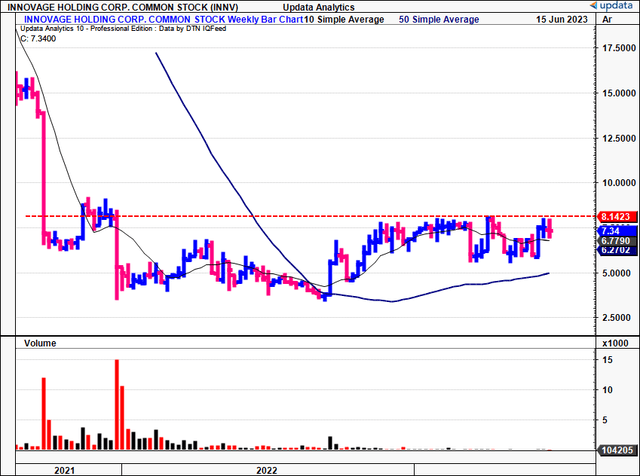
Much can be gleaned from what’s currently happening in the market for INNV. In the absence of earnings data, this helps guide investment reasoning immensely, because it helps show what actual market participants are doing. For one, price action in INNV equity has been stagnant at best for the last 12-months or so, following a large wipe-out in Q4 2021. It has since tried to break the key resistance line multiple times, failing at each block. Volume is negligible either way, buying or selling. It is currently at this mark now (this week), so the next moves are crucial.
Figure 3.
Data: Updata
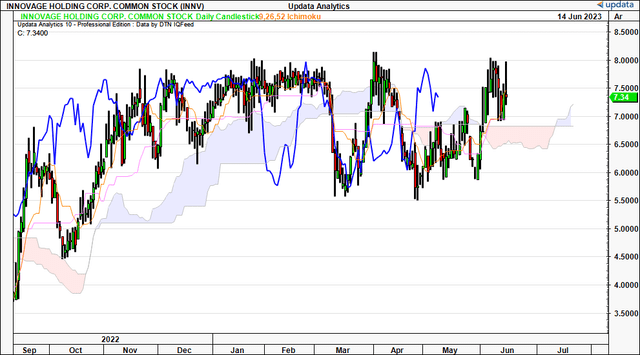
Second point is the stock has broken to new highs lately. On the daily cloud chart, this shows a break above the cloud with the lagging line in situ– bullish factors. Would you jump into a position now based on this? I wouldn’t. But I wouldn’t completely ignore it either, which is another reason why INNV is worth a neutral rating. Further divergence away from the cloud would likely corroborate with a breakout above the resistance shown above.
Figure 4.
Data: Updata
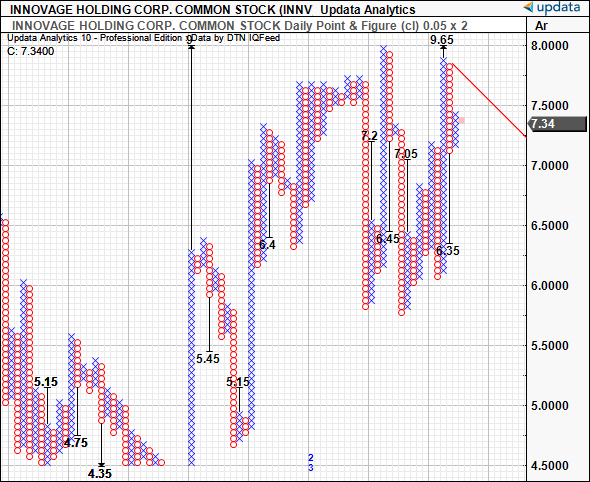
In terms of where the stock may head in the coming weeks, the daily point and figure studies project upside targets to $9.65, and downsides to $6.35. This is quite the breadth. I’d be looking for more confidence around a single target, especially an upside one. The point being is these are objective findings that suggest the stock could trade within a range going forward. In that sense, a push higher is essential to activate that $9.65 target. But these moves don’t really suggest to me immense buying thrusts needed to jolt the stock higher in the medium-term.
Figure 5.
Data: Updata
Valuation and conclusion
A comprehensive and informed appraisal over the critical facts don’t make a 65% discount to the sector more appealing, in my view. INNV is trading at that depth at 1.5x forward sales, all we’ve got to go by considering no earnings. This is definitely worth an initial look, but when turning a few stones, the valuation appears to be justified in my view. For the time being, INNV has a lot to prove before buyers will pay above that mark. Sellers, on the other hand, are likely to accept even lower multiples than this, in my view. Management doesn’t provide guidance, but if you’re looking to consensus as a roundabout figure of FY’24 revenue estimates, you’re getting to $8-$8.50 per share in valuation at 1.5x forward sales (1.5 x 748/135 = $8.30).
These findings are directly supported by quantitative data found in the quant ratings system. It, too, finds issues with valuation and growth, along with my own assumptions. This adds confidence to the data presented. Note, INNV has been rated a hold since July last year.
Figure 6.

Data: Seeking Alpha
In that vein, I am yet to be overturned on my hold rating on INNV. The company has several factors that make its growth trajectory worth keeping an eye on. Added to that, it has strong gross profitability characteristics that could turn in its favour should it start to pull some of that income down to the operating line. But as for what’s tangible today, the market looks to have valued the company about right in my opinion. Net-net, reiterate hold.
Read the full article here


