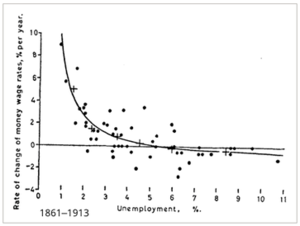
One of the most important economic tools used by economic policymakers over the past sixty years or so is the statistical relationship which is referred to as the Phillips curve.
The Phillips curve purportedly shows the relationship between the rate of inflation in an economy and the amount of unemployment that exists.
The relationship is a negative one, if policymakers can achieve a little more inflation, then the economy can experience a little less unemployment.
That is, if the policymakers can pump up inflation just a little bit, they can contribute to a modest reduction in unemployment.
Here is the original Phillips curve including data from 1861 to 1913.
The Phillips Curve (Wikipedia)
From this chart, one can draw the conclusion that if the government were to achieve a little more inflation, it could reduce unemployment by a small amount.
Thus, if lower unemployment is an important social variable, then the government can achieve a little lower level of unemployment it can raise inflation by a small amount.
And, the original assumption was that the relationship was a stable one.
Milton Friedman, monetary economist, argued in 1968 that the relationship could not be a stable one.
Businesses hired on the bases of their inflationary expectations and not upon what inflation actually was. If inflation comes in higher than expected for a given level of unemployment, businesses will raise their expected rate of inflation and the relationship will have to change.
What one sees in the Phillips curve is statistical points from many, many different time periods, time periods that contained different combinations of inflation and employment, but little or no relationship between inflationary expectations and unemployment.
In fact, as more and more statistics were collected on the relationship between inflation and unemployment, the results showed little or no relationship between the two.
John Cochrane, Stanford economist, is recently quoted as saying,
“There does not appear to be any statistically significant correlation between the two series.”
“If you simply plot inflation against the unemployment rate over the past 50 years, you get a blob.”
In other words, economists have spent 60 years or so working with data on inflation and unemployment to determine some kind of relationship.”
And, at the end of this time period…there appears to be little or no regular connection.
Oh, yes, one can find some relationships that last for a very short period of time since the 1950s, but even in the results, Mr. Cochrane discusses, these statistical relationships don’t really last for any real length of time. And, they certainly do not hold overextended
The real story was told by economist Milton Friedman in his 1968 article. The statistical relationship between actual inflation and unemployment is constantly changing.
Another recent discussion of the Phillips Curve appeared in a speech by Federal Reserve Governor Christopher Wallace. The title of his speech is “The Unstable Phillips Curve.”
Mr. Wallace, in his speech, points out just how unreliable the Phillips Curve actually is.
One should also note, there is no “economic theory” behind the Phillips curve that explains the relationship.
All that has existed about the Phillips Curve is that there seemed, at one time, to be a statistical relationship between inflation and unemployment.
But, whatever that relationship was, it seems to have disappeared into the clouds.
What’s Left?
What’s left is the conceptual idea that in some way the rate of inflation in an economy is somehow related to the unemployment rate.
Conceptually it makes some sense that if policymakers can increase inflation to a level above existing inflationary expectations that businesses will reach out and hire more labor, thereby reducing the unemployment rate.
Politicians wanting to lower the unemployment rate in order to help them get re-elected can try to create a little more inflation to get more people back to work.
The problem is, this is only a short-term solution. As Milton Friedman suggested, as soon as businesses see that inflation is coming in higher than what was expected, they will raise their expectations about what future inflation might be.
The Phillips curve shifts.
And, this can continue over and over again.
But, what do investors take away from this?
They see that the government is consistently causing the inflation rate to increase so as to achieve modest decreases in the unemployment rate and so they start to build this into their expectations.
But, what is happening here?
Higher prices generate higher profits. That is why businesses are hiring more labor and reducing the unemployment rate.
And, this goes on, over and over again.
That is, the government policy is constantly pushing up business profits…which will increase stock prices…which will increase consumer wealth…which will stimulate the economy, justifying the reduction in unemployment.
And, this is just what the U.S. government did.
And, the result of this kind of policymaking I called “credit inflation,” the policy practice that drove the U.S. economy throughout the 1970s, 1980s, and up through to 2020. I have written a lot about credit inflation over the past 15 years or so.
But, investors caught on to this policy approach very early on, especially the wealthier ones.
And, to me, this was the foundation of the economic policymaking that lead to the massive increase in wealth inequality in the United States in the last part of the 20th century and into the first two decades of the 21st century.
Government policymakers, attempting to keep unemployment at very low levels, used the Phillips curve as justification for continuing to generate “a little higher level of inflation” in order to keep down the unemployment rate.
To me, Milton Friedman caught the essence of the Phillips Curve right from the start. The use of the Phillips Curve justified to many, the rising level of prices, consumer prices, and asset prices, in terms of higher and higher levels of employment.
But, the outcome of this exercise is also picked up in the huge increase in wealth inequality.
The investors that caught on to what the government was doing, prospered in a major way.
This is something investors had done, are doing, and should be doing. The government creates major opportunities for individuals to build wealth over time. Investors need to take advantage of these opportunities because, overall, they are a lot less risky than some other types of investments.
Just notice all the people still around that are strong supporters of the use of “Phillips Curve” thinking to keep inflation rising, even though at just “modest” rates.
Read the full article here


