It’s a loud week of economic data. Following a quiet several sessions with the S&P VIX Index (VIX) dipping toward 13 amid a dearth of indicator news, Tuesday’s CPI, Wednesday’s Fed decision, Thursday’s Retail Sales and Jobless Claims, and this Friday’s University of Michigan Consumer Sentiment survey are all major market movers.
Let’s home in on the FOMC’s policy meeting, taking place today and Wednesday.
A Major Week of Key Data
BofA Global Research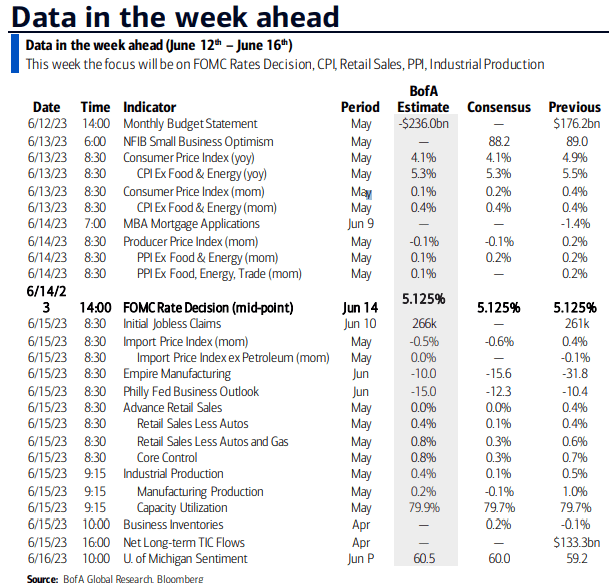
After a somewhat sanguine May inflation report earlier today, the bond market has priced in a mere 5% of yet another interest rate increase tomorrow afternoon. The so-called “skip” is seen as preceding a final hike in July. That should then end this historic tightening cycle. The year-end Fed Funds rate is now priced at 5.11% with a terminal rate of 5.26% from late July through October, according to the CME FedWatch Tool.
A Skip, Hike, Pause, Then Cuts?
CME FedWatch Tool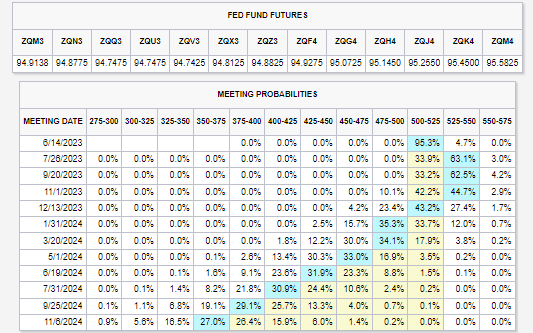
The trend has generally been for higher rates going out on the forward curve. The market now sees the Fed completing its cuts in the second half of 2025 with the policy rate settling around 3.5%. That is great news for 60/40 investors with a significant allocation to fixed income.
Contrast today’s yield on the iShares Aggregate Bond ETF (AGG) near 4.6% to the one seen during the ZIRP (zero interest rate policy) era barely above 1%. A 3.5% Fed Funds rate could mean that a broad bond index fund may yield between 4% and 5% as the yield curve uninverts.
US Aggregate Bond Market Yield Near Multi-Year Highs
WisdomTree ETFs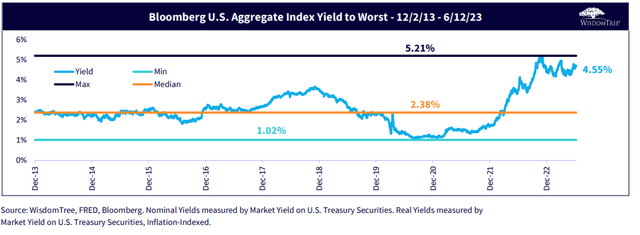
A 3.5% Baseline Fed Rate Priced In By Late 2025
The Daily Shot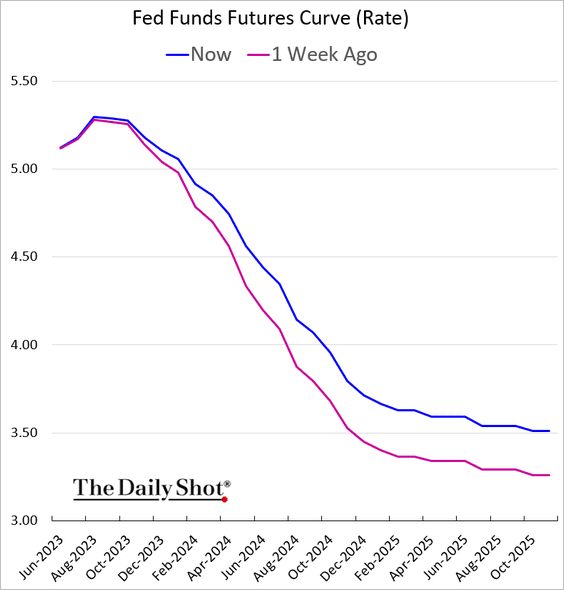
Also key to watch ahead as the FOMC gathers, the ICE BofA MOVE Index that gauges interest rate volatility continues to run high. While other volatility measures in the stock market, forex space, and in commodities are somewhat tame, Treasuries keep on ‘moving’ around.
Corporations hope that daily and weekly swings in yields cool down so that capital allocation decisions-such as capex plans, hiring decisions, dividend and share buyback policies, and balance sheet capital structure mixes can be made with greater confidence. As it stands, the MOVE Index remains far above its late 2020 through mid-2021 range.
Treasury Volatility Remains High
TradingView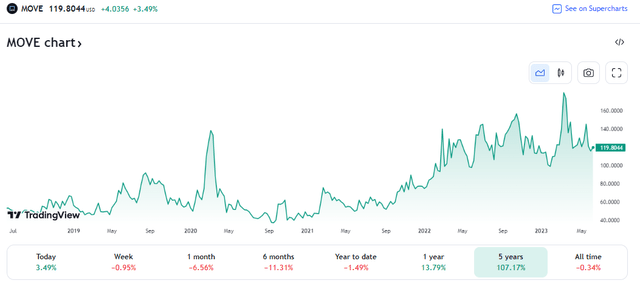
As for the Wednesday afternoon Fed statement, few changes are expected. According to Bank of America Global Research, just a handful of redlines might appear. The big change will, of course, be the language change from raising rates to maintaining the current level of restrictive policy while a more data-dependent approach may be taken.
BofA: FOMC Statement Preview
BofA Global Research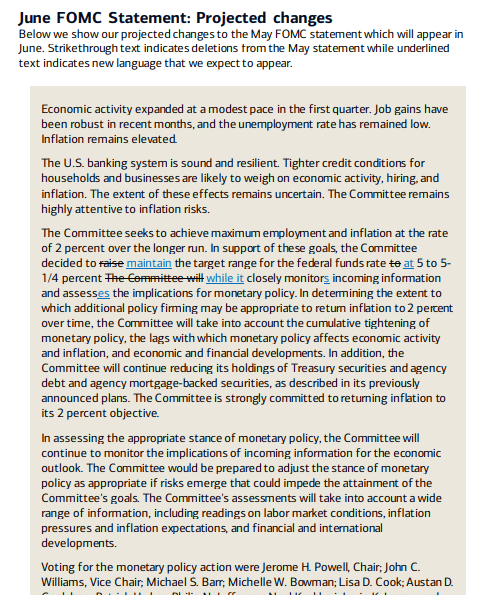
Interestingly, the economic team at Goldman Sachs at least hints at the possibility of the Fed raising its long-term inflation target rate. Normally 2% is the rule of thumb monetary policymakers use when deciding on the Fed Funds target rate, changes at the discount window, and with open market operations. Some suggest that if Core PCE moves down to, say, 2.5%, then that might be good enough for Chief Powell and the rest of the FOMC.
Goldman: An Inflation Target Shift?
Goldman Sachs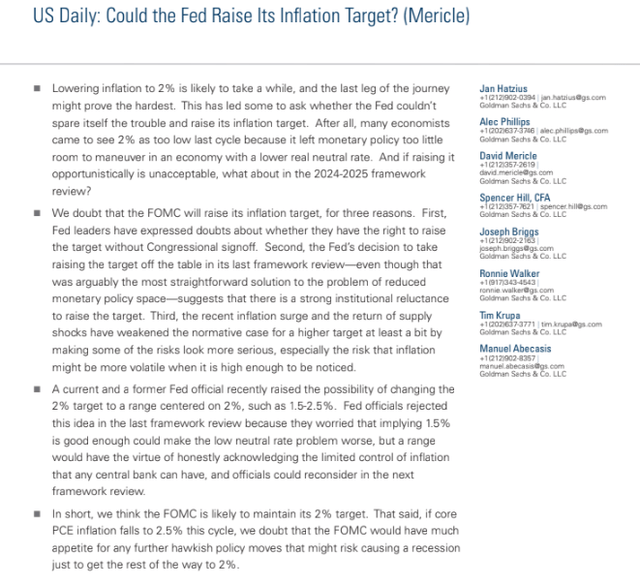
Also consider that longer-term inflation breakevens, which measure the yield differences between TIPS and nominal Treasuries, are very tame, but still modestly above 2%. The “5y5y,” gauging inflation discounted into the 5-10-year range, is right between the long-standing Fed target and the hypothetical 2.5% price stability rate.
10-Year Breakevens: Under 2.2%
St. Louis Federal Reserve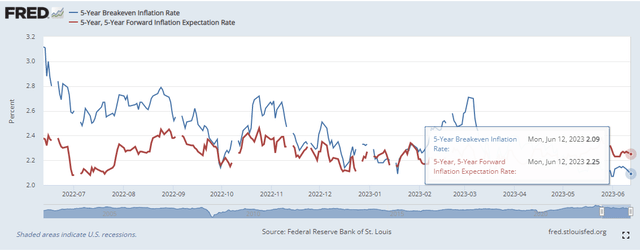
But as for Wednesday afternoon, the market would be shocked by a hike. More focus will be on Fed’s statement and Powell’s press conference that begins at 2:30 p.m. ET.
I will be paying particular attention to the high-yield debt market. Why’s that? Well, the longer the Fed keeps rates elevated, the more it may damage the balance sheets of levered and below-investment-grade companies.
There has been an under-the-radar trend in the credit markets lately, too. Junk bond issuers collectively now have the lowest duration in history, according to Bloomberg. That’s good news for investors concerned about rising interest rates, but bad news for embattled firms that struggle with liquidity.
In Focus: Junk Bonds’ Duration Slims
Bloomberg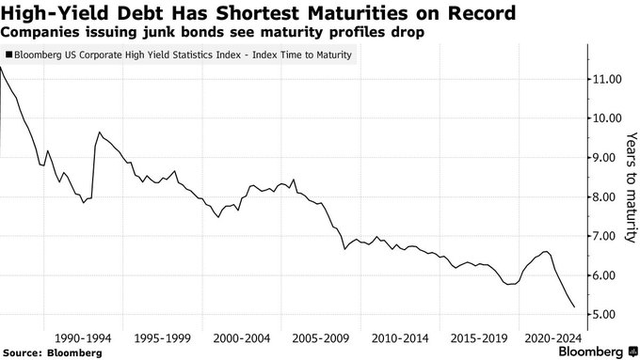
The SPDR® Portfolio High Yield Bond ETF (NYSEARCA:SPHY) is a good proxy for changes in the speculative-grade bond market. According to the issuer, SPHY seeks investment results that correspond to the price and yield performance of the ICE BofA US High Yield Index. It is a low-cost exchange-traded fund, or ETF, with an annual expense ratio of just 10 basis points and offers investors exposure to over a trillion dollars of dollar-denominated high-yield debt.
The ETF can be used alongside, say, AGG to build a diverse fixed-income portfolio. SSGA Funds notes that the index includes publicly issued USD high-yield bonds with a below investment grade rating, at least 18 months to final maturity at the time of issuance, at least one year to maturity, a fixed coupon, and a minimum amount outstanding of $250 million.
SPHY sports an average maturity of its holdings of 5.17 years as of June 12, 2023. The current yield-to-worst is impressive in my view, at 8.77% – above many forecasters’ projections for future S&P 500 annualized returns. The options-adjusted duration is just 3.56 years, so interest rate risk is modest. The significant possible peril is on the credit side of the ledger. Tradability is high with SPHY – the 30-day median bid/ask spread is just 4 basis points.
The ETF’s sector breakout shows a high weighting to the Consumer Cyclical (discretionary) sector, while Communications and Energy are the next highest weights. Overall, the diversification is decent. Many critics counter by saying that a high-yield index fund ends up owning more of the most indebted firms, making it a poor approach. Still, I would rather invest in junk bonds with a basic index fund than an active manager prone to long-run underperformance and higher fees.
SPHY: Sector Allocation
SSGA Funds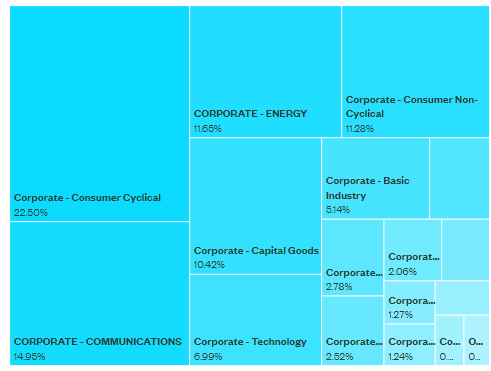
The Technical Take
I like the yield and duration mix on non-investment grade corporates right now, but the chart is less compelling. Notice in the graph below that SPHY is in consolidation mode. A symmetrical triangle is generally seen as a continuation pattern. In this instance, the trend of the larger degree is down, so while the bearish trend that began in earnest during the back half of 2021 has broken, I’d like to see a better bottoming formation before entering a long position. Perhaps a solid reaction after Fed Day tomorrow will be that catalyst.
For now, I would like to see SPHY rally above $23 and close the week there or better. Near-term support is in the $22.20 to $22.35 range.
SPHY: The Consolidation Persists
StockCharts.com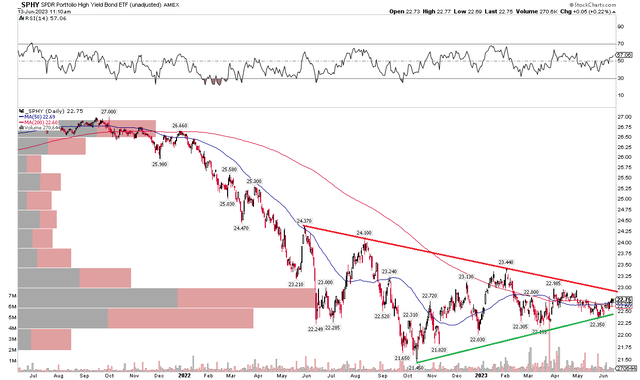
The Bottom Line
I am a hold on SPDR® Portfolio High Yield Bond ETF going into the Fed rate decision on Wednesday. Long-term investors can consider owning the ETF for its low cost and currently high yield in a tax-sheltered account for diversification purposes.
Read the full article here


