Chewy Inc. (NYSE:CHWY) is a leading online retailer of pet products and services in the United States, offering more than 110,000 products from 3,500 partner brands.
The aim of this report is to critically analyze the growth opportunities of CHWY from the perspective of its financial performance and industry trends, with the ultimate goal of valuing the company.
Growth Opportunities
For CHWY to provide solid growth, it is important to see the development across the following areas, many of which provide the challenges of their own:
- Overall industry growth – According to American Pet Products Association (APPA), the pet industry registered almost $136.8bln in sales in 2022, which was a 10.8% increase compared to 2021, with pet foods and treats being the highest spend category (at $58.1bln) and posting the biggest increase (at 16.2% YoY); meanwhile, another category of interest (pet supplies and OTC medicine) showed $31.5bln in sales. The study also indicated that about 66% of US households owned a pet, which makes it 86.9mln households. In other words, we can calculate that, on average, each household in the US has spent about $1,032 in 2022 on pet food, treats, supplies, and OTC medicine, which is in line with what the CHWY’s CEO Sumit Singh mentioned during the Q1 2022 earnings call, namely that the oldest cohorts of the company’s customers spend nearly $1,000 per year. Going forward, the US pet industry is expected to grow by almost 5% in 2023 to reach $143.6bln in total sales. While this does indicate a slowdown from the low-double-digit growth achieved over the last three years, this is still a positive dynamic, nonetheless.
- Penetration of online – As an e-commerce company, much of the size of its serviceable addressable market will depend on the penetration of online to the overall customer spending that we discussed above. According to Packaged Facts, a market intelligence firm, US e-commerce pet product sales reached $30.7bln, which makes it more than 22% of the total spend indicated above, or more than 34% of the categories, arguably, more applicable to CHWY (foods & treats and supplies & OTC medicine). Given this level of online sales, CHWY had a 33% market share, based on its 2022 sales figure of about $10bln.
- New product and service lines – in its reporting, CHWY segments its revenue into Consumables, Hardgoods, and Other categories, which includes, among other things, healthcare products and services:
Table 1
10-Ks/Qs and author’s calculations
While the consumables category is the main contributor to both sales level and sales growth rate, hardgoods are getting ever more less relevant, being substituted by the Other category, which has contributed 21.4 percentage points to the overall 95% total growth in revenue over the last 5 years. In fact, this category, up until Q3 2022, had been the fastest growing among the three.
Indeed, the healthcare component of the Other category, launched four years ago, is currently the largest pure-play e-commerce pharmacy in the North America, according to the company’s management (Q1 2023 earnings call). CHWY’s focus on healthcare can also be seen in the expansion of the company’s CarePlus program, with the launch of Lemonade (LMND), as per the latest earnings call, which will supplement Trupanion (TRUP) in providing pet wellness and insurance services.
These achievements, along with the constant roll-out of private brands, from American Journey and Tylee’s in the consumables category, to Vibeful in the healthcare, to Frisco in the hardgoods, may potentially play an important role in creating customer stickiness and improving the company’s gross margin.
- Expansion into international markets – Up until today, CHWY has been a US-based, US-focused online pet products and services company. But this is about to change soon, as the company has plans to expand its operations to Canada, starting from Q3 of 2023 and initially focusing on the Greater Toronto area and gradually expanding from there (as announced during the Q1 2023 earnings call). On the face of it, this looks to be a logical step forward for the company to further expand its TAM and grow sales. But let us take a step back and look at the whole picture. By some measures, the Canadian pet food market was estimated to be $2.8bln in 2021, with around 57% of households owning a pet (or approximately 6mln households, given there are 10.61mln households in Canada). To estimate the total addressable market, which apart from food also includes pet supplies and medicine, let us assume that the spending habits of the households in the US and Canada are similar (at least, when it comes to pet ownership). With that in mind, given there are 6mln households in Canada and the average pet spending of $1,032 per year in the US, the Canada pet industry size can be estimated to be around $6.2bln in 2022. While this is already significantly less than that of the US ($89.6bln, as per the above), consider that only 23% of pet spending in Canada is made online (versus 34% in the US, as mentioned earlier) – in other words, the online pet industry size of Canada, on implied basis, likely stands at only $1.4bln, compared to $30.7bln in the US. Looking from a different angle, during the latest earnings call (Q1 2023), the company’s CEO mentioned that the Canadian market is expected to be “between $12bln-$15bln over the next four to five years, growing at a slight premium to [that of] the US”. He also mentioned that the e-comm penetration was 1,000-1,200 basis points below the US. Indeed, based on my estimate of $6.2bln in 2022, this would imply a 5Y CAGR of 14%-19%; meanwhile, the US pet industry grew at roughly 11% per year from 2018 to 2022, using the abovementioned APPA data. Also, Canada’s online pet market share of 23% is some 11 percentage points (1,100 basis points) below that of the US.
As a result, while Canada does present a new market for CHWY and online penetration will likely expand, the sales growth rates are likely to be not substantially more than the most recent 3-year trend of low double-digit rates.
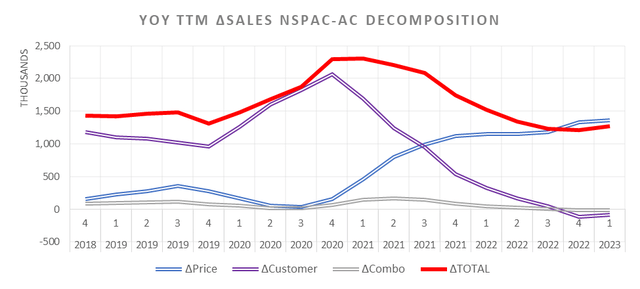
- Growth in the active customer count and net spend per customer – this is an interesting one. As of Q1 2023, CHWY had 20.4mln active paying customers, generating around $512 per active customer, on TTM basis, in sales (NSPAC), translating to $10.5bln in sales, or 13.8% YoY growth. For better visualization, we can decompose the rolling TTM change in sales (∆Total) into NSPAC (∆Price), active customer (∆Customer), and the combination of the two (∆Combo):
Figure 1
10-Ks/Qs and author’s calculations
It is noteworthy the contribution of customer growth to TTM sales has been steadily declining starting from 2021, while the NSPAC has increased; such that in 2022 customer growth has become even negative.
Let us take another look at these trends on cumulative basis over the last 5 years:
Table 2
10-Ks/Qs and author’s calculations
Here again we can see that what used to be a 50% contribution to the overall change in sales, has gradually become a drag to sales growth during the last 12 months, while price contribution (the NSPAC) is currently the single driver of revenue growth for CHWY.
This is a worrying trend for the company – while the NSPAC may continue to increase as the older customers spend more on the platform, that growth is inherently limited (as mentioned earlier, the oldest cohorts spend around $1,000 per year), as this would represent, roughly, 14% growth ahead over the next five years.
Valuation
To start with, the value drivers that we shall discuss below will center around my views on CHWY – a leading US online pet food and services retailer, aiming to expand its operations outside the US, but faced with headwinds in the active customer growth and relatively small new addressable market of Canada.
- Growth – for revenue growth over the next five years, I will assume that CHWY will maintain its 33% share as the US pet market continues to grow at close to 7% CAGR and the Canadian market reaches $12bln in size (as per the company’s management expectation above). This will imply a 5Y CAGR of about 15% (some 3 percentage points higher than the upper bound for the FY’2023 sales growth guidance by the management), upon which CHWY will reach annual sales of almost $21bln five years from now.
From that period onwards, the company’s sales growth will be projected to gradually decline to the terminal rate of 3.75%, equal to 10-Year US Treasury Note.
- Profitability – Being an online retailer, there is a limit to how high CHWY’s gross margin can go. To put it simply, while being an online business, it is not as asset-light a platform as the likes of Etsy (ETSY) or eBAY (EBAY) (whereby the take-rate from each transaction is earned); as the company purchases and holds an inventory of pet products, it is, by construct, likely to generate lower GM. While the Q1 2023 figure of 28.4% is an improvement over the 18% reached in FY’2017, the ceiling will likely be reached at around 35%, somewhat similar to PetMed Express (PETS), as opposed to 65%-75% for ETSY and EBAY.
Switching to operating margin, on GAAP basis and as of Q1 2023, CHWY is EBITDA positive (1.7%) and marginally EBIT positive (0.4%). As is usually the case, in its reporting, the management also provides the adjusted EBITDA calculation, which, not surprisingly, shows an even higher EBITDA figure. Once again, the stock-based compensation (SBC) expense is the single most important factor driving this unjustified improvement. As mentioned in my previous articles, while being a non-cash item on the face of it, SBC is a recurring expense on the income statement and, therefore, by adding this item back, we run the risk of understating future expenses. To see the extent of the issue, we can look at the percent contribution of SBC to the EBITDA adjustment in each of the last five years:
Table 3
|
TTM Q1’2019 |
TTM Q1’2020 |
TTM Q1’2021 |
TTM Q1’2022 |
TTM Q1’2023 |
|
|
EBITDA |
($201) |
($220) |
$65 |
$2 |
$180 |
|
SBC |
$18 |
$170 |
$102 |
$80 |
$181 |
|
Adj EBITDA |
($193) |
($62) |
$159 |
$62 |
$355.6 |
|
SBC contribution |
231% |
108% |
109% |
135% |
103% |
Source: 10-Ks/Qs and author’s calculations.
We can clearly see that the SBC expense is quite a staggering item in the adjusted EBITDA figure. By this logic, it is preferable to retain the SBC expense.
Looking forward, and following up on the discussion above, I would expect CHWY, thanks to its strong market position, to attain an EBIT margin higher than 3% (median US online retailer) but lower than 15%-25% range (ETSY and EBAY). In other words, the expected long-term operating margin used in the model will be 10% (roughly, the level PETS achieved a while ago).
Given the uncertainty around this figure, the Monte Carlo simulations will be used below to account for the possibility of higher margin levels.
- Reinvestment – this is a composite term that includes three important items: capital expenditures (including acquisitions and divestments), depreciation and amortization expenses, and working capital investments. For the purposes of valuation, the sales to reinvestment ratio will be used to project future reinvestment activity of the company. By construct, the higher the ratio, the more efficient the company is at generating revenues. For CHWY, over the last three years (in TTM periods), given its online business, the ratio hovered around 6.0 and 9.0, and I will use the lower bound of 6.0 in the model.
To calculate the reinvestment rate in the terminal period, we shall use the re-arranged sustainable growth formula at the stakeholder level:
Reinvestment rate = Sustainable growth / ROIC,
whereby the sustainable growth will equal the 10-year Treasury Note rate of 3.75% and an ROIC of 8.25% (equal to terminal period WACC):
Reinvestment rate = 3.75% / 8.25% = 45.45% (to be multiplied by the after-tax adjusted EBIT to arrive at an absolute value).
- Risk – using market values of equity and debt (including leases), we have the following:
|
Equity |
After-Tax Debt |
Capital |
|
|
Weight in Cost of Capital |
97.7% |
2.3% |
100% |
|
Component cost |
11.95% |
5.04% |
11.79% |
The equity component was calculated using the risk-free rate of 3.75%, ERP (geographically weighted by sales) of 5.94% and a levered bottom-up beta of 1.38. The pre-tax debt component was computed as the SOFR plus 1.5% (the mid-point of the company’s Asset-Backed Credit Facility terms):
Cost of Equity = 3.75% + 1.38 * 5.94% = 11.95%
Cost of Debt = (5.05% + 1.5%) * (1 – 23%) = 5.04
Consequently, the 5-year transitional WACC of 11.79% will be linearly adjusted downwards during the remaining five years to a terminal rate of 8.25%.
Apart from these major assumptions, the following has been applied in the model as well:
- Share count of 447.2mln (including RSUs)
- Marginal tax rate of 23%
- Value of debt of $528.4mln, including leases;
- Loss carryforwards of $1.85bln, which will reduce the taxable base;
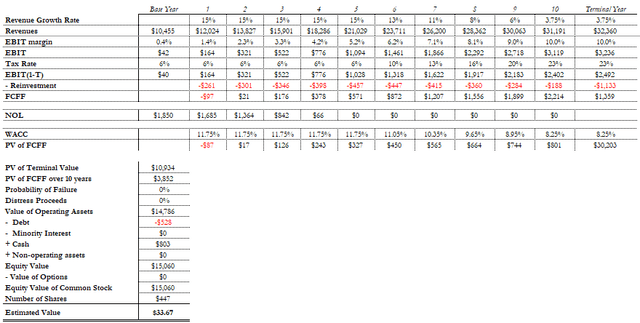
The table below presents the model results:
Author’s calculations
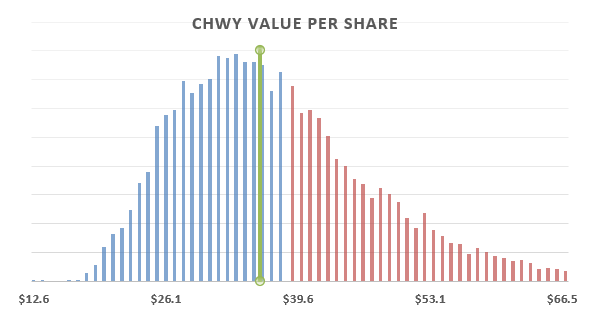
At current price per share of around $38 and the computed value per share of almost $34, the stock is overvalued by more than 12%. To account for the uncertainty factor in the main assumptions discussed above, the Monte Carlo simulation of 10K trials has been conducted by applying probability distributions to base-case assumptions of revenue growth, operating margin, reinvestment ratio, and the WACC. The results are provided below:
Figure 2
Author’s calculations
Figure 2 shows the median value per share of $35.7 (vertical green line) and the area (colored red) above the $38 mark. As a result of these simulations, given the distribution assumptions, it appears there is around 60% chance the stock is overvalued at the current price of about $38. However, since the distribution range is quite tight (only 6% overvaluation against the median value of $35.7), there are numerous scenarios under which this gap can easily be closed, resulting in my current view on the stock being neutral.
Read the full article here


