As a rather outspoken person myself, it’s refreshing to see a management team actively relate to the market why the market’s perception of the business in question is wrong. For Medical Properties Trust (NYSE:MPW), a REIT that’s focused on the ownership of and leasing out of medical properties, this outspoken behavior began in late March when the company filed a lawsuit against Viceroy Research and its members for certain allegations the short selling firm had made and what Medical Properties Trust believed were misrepresentations of the business aimed at manipulating the stock. There have been a couple of other instances of management pushing the market to recognize that the picture of the firm is far better than many currently believe. The latest example of this came on June 6th when the company put out a rather interesting investor presentation. This takes a slightly different look at the company compared to what others have in the past. And what it reveals is that, while management might be a little too optimistic, they are correct in that shares are drastically undervalued at this time.
Management’s bull case
On June 6th of this year, the management team at Medical Properties Trust released a presentation detailing why the company should be considered a compelling prospect for investors. At the very beginning of the presentation, the firm asserts that it still remains an active investor in real hospital assets. I won’t focus too much on this, because many of the views espoused by management are subjective in nature. But examples include their belief that the physical properties they own are well maintained and utilize modern technology. While not necessarily subjective in nature, these are blanket statements that don’t have any backing provided by management. The company also points out a variety of other attributes, such as the desirability of locations that it owns. But again, these points are not terribly fleshed out in the presentation.
Medical Properties Trust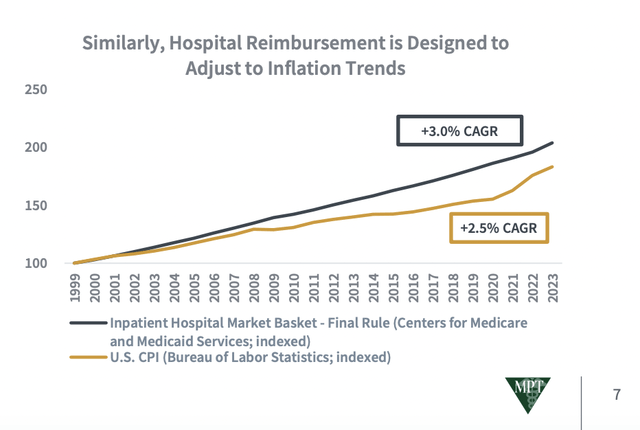
As you move throughout the presentation, however, the company does start to provide some rather interesting data points that investors can rely on. For instance, they point out how, historically speaking, hospital reimbursement rates have exceeded inflation over the past several years now. A chart dating back to 1999 shows a meaningful departure occurring around 2008. And from 1999 through 2022, the annualized rate of hospital reimbursements grew by 3%. That compares to the 2.5% annualized rate seen from inflation.
Medical Properties Trust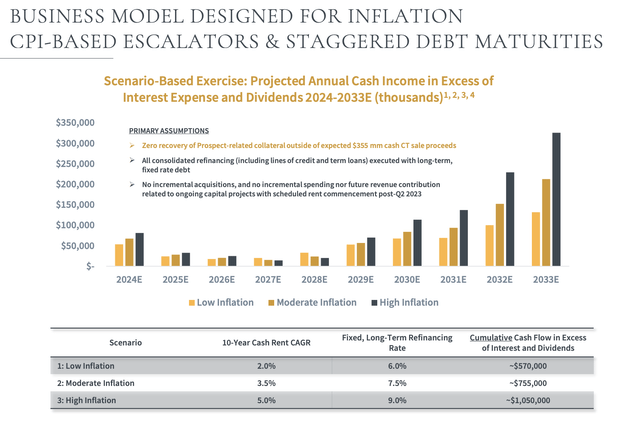
The company even went so far as to provide a sensitivity analysis to show projected annual cash income for the company in excess of interest expense and dividends from the 2024 through 2033 fiscal years. This analysis looks at a low inflation rate, a moderate inflation rate, and a high inflation rate. Thanks to CPI-based escalators in its contracts, as well as staggered debt maturities, the company sees cumulative cash flow in excess of interest and dividends coming in stronger the higher that inflation is. Under the low-rate scenario, for instance, the company should accumulate $570 million in additional cash between 2024 and 2033. A high rate of inflation, meanwhile, should work out to $1.05 billion in additional capital. This is even factoring in fixed long term financing rates for the company scaling up on the debt that it recycles. Under the low inflation rate scenario, for instance, the long-term refinancing rate would be 6%. This climbs to 9% under the high inflation rate scenario.
Medical Properties Trust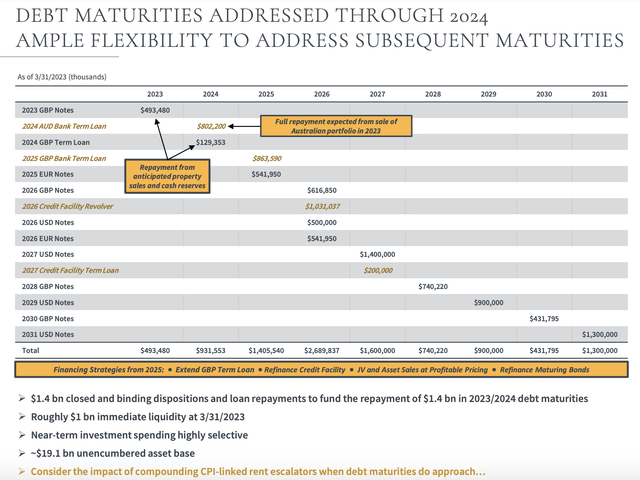
One complaint that investors have had is that the company does have a great deal of debt on its books. But the good news is that none of this is slated to come due soon that the company has not accounted for. When you factor in recent financial transactions, you see that the company won’t have any debt coming due until the $1.41 billion that is expected to mature in 2025. Ideally, interest rates will be lower by that point, allowing the company to more easily refinance the debt. Of course, it is possible that the firm my cell off additional assets between now and then. At present, for instance, the company has about $19.1 billion in unencumbered assets. That should allow it a great deal of flexibility as time goes on.
I know that, very recently, many market participants have given off a rather jaundiced look at the company’s asset sales. This is because a few of them have resulted in the firm essentially breaking even, which really means losing money on an inflation adjusted basis. But as you can see in the image below, when you look at all of the most recent transactions as a group, the company has done reasonably well for itself. An original cost basis of $4.4 billion turned into value upon sale of $5.3 billion. So even though the company may have a dud from time to time, it has had mostly winners from an asset sale perspective.
Medical Properties Trust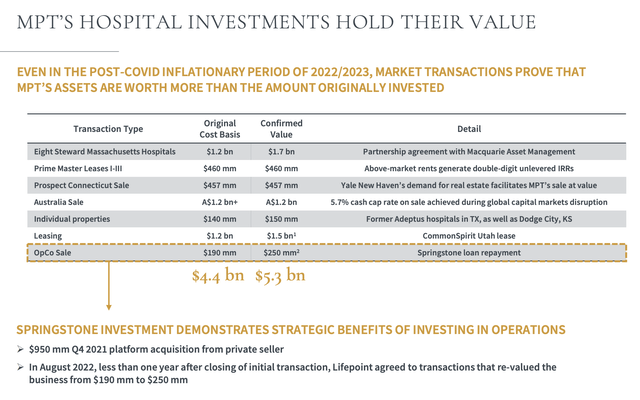
All of this is great to see. But there is more that investors need to pay attention to besides the fact that the company should be strong in an inflationary environment and that it has a good track record when it comes to asset sales. On top of this, investors need to be paying attention to how shares are actually priced. I have performed analyses of the company in prior articles such as this one here. But in its investor presentation, management provided an analysis of their own.
Medical Properties Trust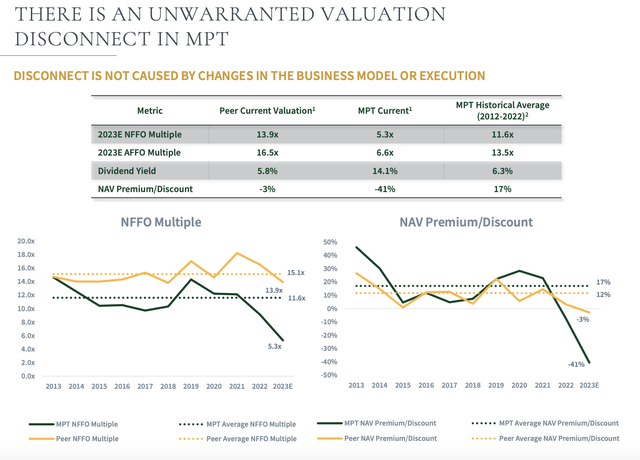
As you can see in the image above, management paints the company as being drastically undervalued relative to both its historical valuation and similar firms. I must be clear on this. Given certain non-cash items that are included in its normalized FFO (funds from operations) that are stripped out of the adjusted FFO, I do believe that the latter is a more appropriate measure of the value of the company. So for the purpose of analyzing the business from here, I will utilize only that method. Also, for context, this data is all based on data from the very end of May of this year. But since then, shares have risen by 11.4%. Making this adjustment, the price to adjusted FFO multiple other company has moved up from 6.6 to just under 7.4.
If we compare this to the historical average of the company as provided by management, it would imply upside for shareholders of 83.7%. As a shareholder of the company who has analyzed the business quite a bit, I would make the case that this sort of valuation and upside is reasonable. In fact, it might even be a bit on the light side. Relative to similar firms as provided by management, however, upside is even greater at 124.5%. Management also pointed out that the current yield on their stock is 14.1% compared to the 5.8% seen from the peer group.
As with any analysis, the devil is in the details. As soon as I saw the competitors listed, I wanted to see if perhaps management was comparing the company to firms that are of similar health to it, or if management was perhaps painting too rosy a picture for shareholders. To understand what the situation was, I decided to look at these five competitors through two different lenses. The first was the net leverage ratio of the firms. As you can see in the table below, these companies range from a low of 5.24 to a high of 6.85. Based on my own calculations, which include making adjustments for recent asset purchases and sales, Medical Properties Trust has a net leverage ratio of about 6.98. This place is at higher than any of the competitors. But it’s not far off from three of them. The average of the three most expensive comes out to 6.64. So on this basis, I would say that the peers that management used are most certainly appropriate.
| Company | Net Leverage Ratio |
| Medical Properties Trust | 6.98 |
| Healthpeak Properties (PEAK) | 5.40 |
| Ventas (VTR) | 6.85 |
| Welltower (WELL) | 6.75 |
| Healthcare Realty Trust (HR) | 6.32 |
| Omega Healthcare Investors (OHI) | 5.24 |
*Data from here, here, here, here, here, and here
The other way that I looked at management’s assessment was in relation to the yield that each company pays. Yes, the current yield for Medical Properties Trust might be through the roof. But is the distribution sustainable relative to similar firms? As you can see in the table below, I looked at the distribution coverage ratio using total distributions for the 2022 fiscal year and adjusted operating cash flow as the metric that matters. This is operating cash flow after adjusting for changes in working capital. For instance, when it comes to Medical Properties Trust, the company paid out 93.2% of its adjusted operating cash flow to distributions. This is actually not the greatest coverage and it implies that a distribution cut could eventually occur. But as the table shows, two of the five companies that management cited as peers have coverage ratios that are very similar. A third one, meanwhile, is not terribly far off at 82.9%.
| Company | Distribution Coverage |
| Medical Properties Trust | 93.2% |
| Healthpeak Properties (PEAK) | 82.9% |
| Ventas (VTR) | 62.6% |
| Welltower (WELL) | 77.0% |
| Healthcare Realty Trust (HR) | 92.8% |
| Omega Healthcare Investors (OHI) | 94.3% |
*Data from here, here, here, here, here, and here
Takeaway
From all that I can see, management is making some really interesting and positive moves. It’s great to see how management views the company. Some of the data, such as how the company should fare in an inflationary environment, is excellent to see and it provides a fresh and unique look at the company and its prospects. The valuation of the firm seems reasonable, even though the higher net leverage ratio of the business compared to the comparable firms listed suggests that perhaps Medical Properties Trust does deserve to trade at a bit of a discount from the group. The yield, meanwhile, also looks to have poor coverage. But it’s not alone in this regard. All things put together, what the analysis does demonstrate is that shares of the business do you look very much undervalued at this time and, as time goes on, it’s likely that the market will come to terms with this. For these reasons, I have no problem keeping the company rated a ‘strong buy’ at this time.
Read the full article here


