Written by Nick Ackerman, co-produced by Stanford Chemist. This article was originally published to members of the CEF/ETF Income Laboratory on May 27th, 2023.
XAI Octagon Floating Rate & Alternative Income Term Trust’s (NYSE:XFLT) latest semi-annual report shows that coverage of the distribution remains strong. Although there was a declaration in the latest quarter over the prior year-over-year, there was a material improvement. This was, of course, thanks to rising interest rates.
I’ve been following XFLT fairly closely in the last year, as it was one fund set to benefit from higher interest rates in terms of its income generation. That said, it hasn’t been without its drawbacks too. We’ve still seen the decline in the share price that also comes from higher interest rates and credit risks increasing.
Since our previous update, the distribution has increased from $0.073 per month to $0.085. As we noted in the previous update, this increase was expected due to regulated investment company requirements for distributions. Income generation rises, and the obligation to pay out a higher distribution also rises despite what the actual underlying portfolio is doing.
An increase in the distribution from a fund that was already sporting a ~14% distribution yield seems a bit crazy, but we have to follow the numbers. The numbers told us that an increase was probable, and in this case, that’s exactly what happened.
XFLT Performance Since Prior Update (Seeking Alpha)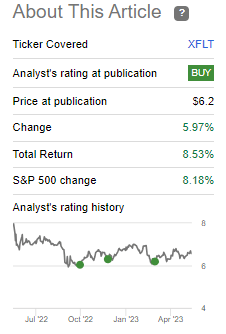
It hasn’t necessarily been that long since our previous update, but with a new semi-annual report, I wanted to provide an update on the latest figures. The fund has provided a total return that’s fairly competitive since our March 27th, 2023, article posting. The fund has begun trading at a slight premium, but it’s not at any sort of gross overvaluation. That could make it a fairly interesting fund to consider for investors at this time.
The Basics
- 1-Year Z-score: 0.75
- Premium: 4.84%
- Distribution Yield: 15.53%
- Expense Ratio: 4.45%
- Leverage: 40.53%
- Managed Assets: $405.233 million
- Structure: Term (anticipated liquidation date December 31st, 2029)
XFLT’s objective is to “seek attractive total return with an emphasis on income generation across multiple stages of the credit cycle.”
They will do this through “a dynamically managed portfolio of floating-rate credit instruments and other structured credit investments within the private markets. Under normal market conditions, the Trust will invest at least 80% of managed assets in senior secured loans, CLO debt and equity.”
The fund is highly leveraged, and given the risky nature of the underlying junk-rated portfolio, we’re definitely looking at a fund with risks. This is a more volatile fund already, and then the CEF structure allows for discounts/premiums that can make it even more volatile. So this isn’t a fund that is necessarily appropriate for everyone.
The fund’s expense ratio in the latest report has moved up to 4.45% from 3.94% a year ago. When including interest expenses, the expense ratio climbs up to a pretty shocking 8.67%. That’s an increase from the 6.29% it was in the year-ago semi-annual report.
While that is high, it’s not unusual for funds with exposure to CLOs. This is lower than what we see from Oxford Lane Capital (OXLC) and Eagle Point Credit Co (ECC), which are pure-play CLO funds. XFLT takes the approach of CLOs and senior loans.
XFLT Asset Allocation (XA Investments)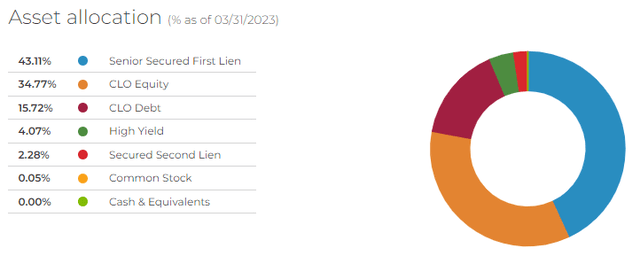
The rising expenses here are due to more expensive forms of preferred leverage. However, the benefit is that these fixed-rate costs haven’t been increasing their borrowing expenses, like the credit facility financed at a floating rate of SOFR plus 1.45%.
They have 6.5% 2026 Preferred Shares (XFLT.PA) and 6% 2029 Convertible Preferred Shares. At the end of March 2023, they had $122.35 million outstanding on their leverage facility. The average borrowing rate was 5.45%, while the ending borrowing rate was 6.25%. So we’ve now reached the point where the preferreds are competitive against the floating rate.
Latest Semi-Annual Report
The latest semi-annual report shows us that net investment income increased substantially if we annualized out the latest six-month figure and compared it against the last fiscal year. We would actually arrive at a nearly 31% increase.
XFLT Semi-Annual Report (XA Investments)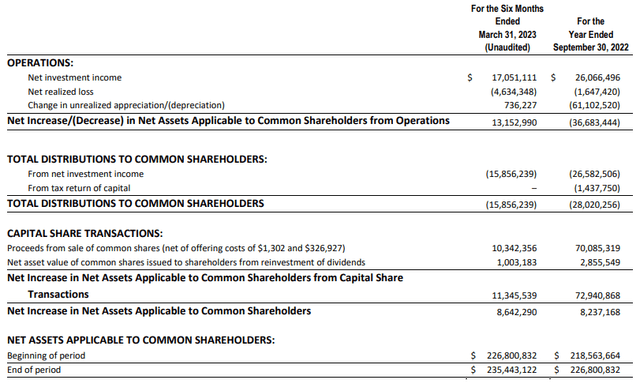
However, this fund can issue shares through an at-the-market offering and through its dividend reinvestment plan. Additionally, the fund has engaged in secondary share offerings. Given that these have been done at premiums to the NAV, that has resulted in accretion on a NAV per share basis in the past. However, these sorts of things can sort of mask NII figures when we look at them on an absolute basis. The idea is raising more capital, and more shares is obviously going to increase income generation. It really comes down to if we are getting incremental gains on a per-share basis.
Therefore, if we go down to the per-share data, that can give us a better idea of what sorts of increases or decreases we are seeing more accurately.
XFLT Semi-Annual Report (XA Investments)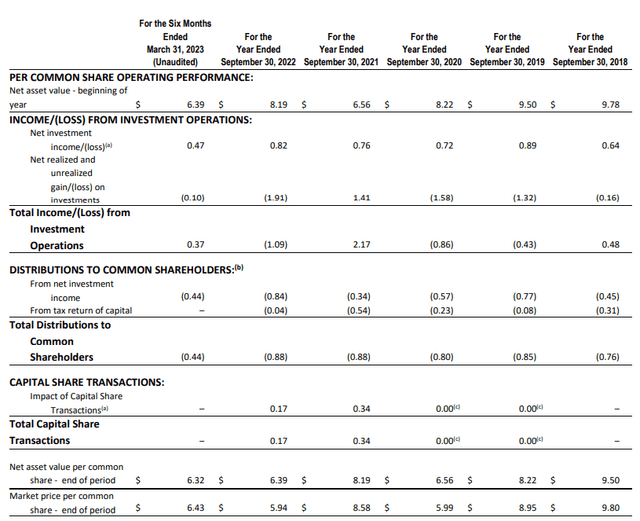
That’s where we see the latest six-month figure arrives at $0.47. In annualizing out that figure to the prior fiscal year, we once again see an increase. This time it’s an increase of 14.63% over the prior full-year period. That’s a positive for investors as rising interest rates have provided for rising NII on the fund.
If we look at the prior semi-annual report for the six months ended March 31st, 2022, we see similarly that the latest report has been trending in the right direction. At that period, it came in at $0.39 or what would amount to an increase of 20.51% over the comparable six-month period.
However, it isn’t all necessarily good news. One might notice that $0.47 annualized only works out to $0.94 against the $1.02 annual distribution. That shows that coverage has slipped with the latest report to only 92.16%.
This came about as the distribution increased and the NII decreased in the latest quarter. We know that the latest quarter showed a decrease because their Q4 2022 financial reporting showed NII at $0.26 per share. That was for the three months ended December 31st, 2022. With a $0.47 figure for the last six months, we know that we’ve seen a deceleration to $0.21 in the latest quarter.
The good news here is that quarter to quarter; there can be some variation as dates that underlying investments pay differ. The longer periods of six months and a full year are better representatives of providing a fuller picture.
Additionally, since they increased the distribution, it would be reasonable to assume they don’t plan to decrease it in the near term. We should expect that their assumption is based on what information is available for now and that they can support it going forward.
This actually wasn’t uncommon from what we saw from their CLO peers, either. OXLC reported NII of $0.22 for their latest quarter, a decline from the $0.26 in the prior quarter. They also increased their distribution when announcing their latest quarter.
ECC saw NII come in at $0.35 in their latest quarter too, which was a decline from the $0.37 they provided in the previous. The $0.37 was taken from the $1.53 NII reported at the end of 2022 against the nine months reported at the end of September 30th, 2022, of $1.16.
OXLC and ECC both rely on providing non-GAAP numbers such as “core NII” or “NII and realized capital losses/gains.” So it might not be directly comparable, but the general idea is that the latest quarter, on a GAAP NII basis, all showed a decline.
Conclusion
The earnings and coverage will be something to watch going forward in the following reports. We’ll be looking to see if this softness continues or if we can get a trend of higher earnings going again. It’ll be a particular focus now that they’ve increased their distribution, but the latest quarter would show that it isn’t covered now when it was previously fully covered.
With a distribution yield pushing near 16.5% on a NAV basis and operating expenses of nearly 4.5%, it’s almost amazing that it’s covered as high as it is now. With enough coverage previously, that made them comfortable for the distribution increase in the first place.
The latest quarter could be a temporary softness, and we could see an acceleration in the following quarter. The Fed bumped up interest rates further since this report, which could provide for an increase in NII. While the Fed was largely expected to pause, the latest data shows that we could get another 25 basis point hike in June. That could potentially benefit XFLT’s coverage, assuming we aren’t getting to the level where damage is too great, and defaults tick higher.
If we head into a recession and the Fed cuts interest rates, that’s another risk going forward. Not only for the credit risks that would increase during a recession, but lower interest rates could see the yields come down on the debt holdings they carry right now. Simply put, the benefit of increasing interest rates we’ve been seeing would be reversed. That would likely be another thing to put pressure on the fund’s earnings.
Overall, this is an interesting fund for a high-yield play that carries some high-yield play risks. A liberal amount of leverage and mostly below-investment grade exposure, along with the fund’s discount/premium mechanic inherent in a closed-end fund, means there are many moving parts to consider before investing.
Read the full article here


