“The investor’s chief problem, and his worst enemy, is likely to be himself. In the end, how your investments behave is much less important than how you behave.” – Benjamin Graham
The Macro View
“Sell in May and Go Away” is a popular adage referring to the perceived seasonal weakness in the stock market between Memorial Day and Labor Day. Depending on what areas of the market you are concentrating on that adage has held. However, other areas of this Jekyll and Hyde equity scene have been anything but a “sell-and-go away” event.
It’s the reason why no one should make investment decisions on seasonal factors alone. When we reviewed the sector performance for May last week, we saw how it would have been an easy decision to sell Energy (XLE) (-7%) and load up on tech (XLK) (+9.5%) on May 1. Investors should also not believe they are so good they can dance in between the raindrops and move from sector to sector “precisely” when the trend changes. That is a difficult ‘ask’ for any money manager and it’s why the best advice is to always be in the market to some extent, and to stay diversified, never abandoning one group entirely.
The month of May is in the books and there seems to be a steady increase in analyst forecasts catching up to the fact that a recession is in our future. The only question seems to be when. Others are growing frustrated that the widely broadcast doomsday scenario keeps getting pushed into the future. Goldman Sachs sees the probability of a recession at only 25% in the next 12 months. That is down from their earlier forecast of 35%. The strong labor market is cited as the reason for the less pessimistic view.
“Continued strength in the labor market and early signs of improvement in the business surveys suggest that the risk of a near-term slump has diminished notably,”
That keeps the glass-half-full mindset going and there are other signs to support that view. Investor sentiment always plays a large part in what is going on in the short term. The Debt Ceiling soap opera has ended, and investors have turned their attention to some of the tailwinds supporting stocks. These include better-than-expected earnings, no additional signs of banking stress, resilient housing, and employment data, and the prospects of an AI-driven productivity boom.
Good Economy/Bad Economy
The economic data is conflicting and when there is conflicting data an economist can spin a yarn any way he or she wants. One day we see more red flags, the next is a strong consumer or services report that challenges the negativity. Consumer sentiment is weak, and while the consumer has pulled back, they are hardly cracking.
Certain segments of the economy remain strong as consumers are still “unwinding” from being locked up during Covid.
Airline Security (www.tsa.gov/travel/security-screening)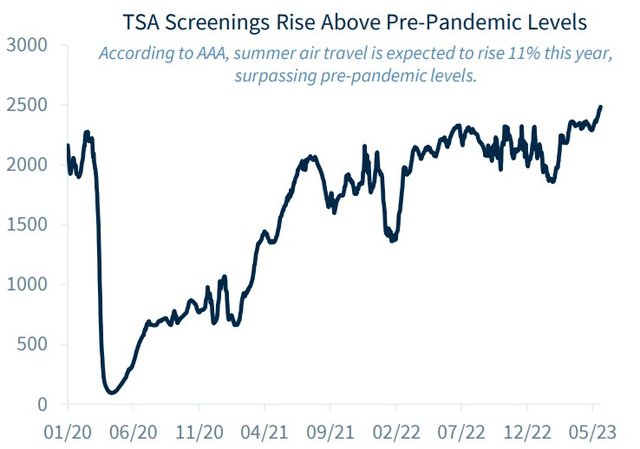
Airline traffic and associated spending is continuing to show a strong trend as TSA airport data shows ‘screening’ are back above pre-pandemic levels.
I’ve highlighted the rising consumer debt issue which reached a new high at $17 trillion recently. I differ from those that use that as their linchpin to suggest it will kill the economy. At the moment I see the debt level as a drag on growth over the next several quarters, but an outright “crisis” is off the table unless there is a huge change in the resilient job market. Delinquencies are rising on credit cards and auto loans, but that process is happening slowly because employment remains strong and as long as consumers have a job, they tend to pay their debts.
All of this suggests investors are going to keep the glass half full feeling around for a little longer and that keeps them from getting too bearish for now. More importantly, that is being played out in the price action, and it has to be respected because the near-term euphoria can feed on itself.
One issue that was pegged correctly from the outset; There is no banking crisis. It was more like a crisis of incompetence and negligence. So for now at least, the impact seems to be more directed at slowing growth than creating a full-on, systemic economic pullback. That has helped the overall market sentiment stay out of ‘crisis’ mode. Last weekend I introduced a concept to clients that has to be part of the dialogue now.
Technology vs. Everything Else
When we talk strategy it will be important to identify what “market” we are talking about. The evidence strongly suggests many stocks already reflect at least a modest recession “on the horizon,” so they have been derisked in that sense. However, any upside beyond dividend income could take some time to unfold.
For instance, many industrial bellwethers are off 20-30% from their peaks. The cyclical metal companies are closer to their ’22 lows than highs. There are a few problem banks, but the healthy survivors that make up the regional bank index, are now down 30-35%% from their peak, with many stocks trading at or below book value. Big, diversified, and relatively stable dividend-paying stocks in telecommunications, energy, and pharma are sporting PEs in the low double digits (or lower) and dividend yields between 3%-5%.
Many big retailers, which recently reported earnings, seem priced for hard times ahead: Home Depot (HD), which disappointed modestly, is now off 16% from recent highs and trading at 18x earnings; Target (TGT), which plummeted 40% at the beginning of this bear market in February last year, has been stuck in the mud for months. Even within the currently hot large-cap tech space, relative bargains are still to be had. Google (GOOG) (GOOGL), for example, is still down 20% from its highs and is trading at 19x forward earnings. Not cheap, but not crazy given its strong balance sheet, near monopoly position, and potential for growth from its artificial intelligence push.
My MACRO view on the economy has not changed since last year. Despite the “animal spirits” unleashed by Artificial Intelligence, I remain grounded in the fact that we are experiencing an economic slowdown, inflation is hanging on, and the FED is still on the scene. No, I’m not in denial that AI is real or it will be a potential game “changer”, I’d rather weigh all of the evidence to produce a market strategy.
I can’t say what stocks will do when the Fed makes its next move, and therein lies the problem with trying to forecast what’s ahead for equities. We can now add the word “skip” to the Fed’s vocabulary because it’s highly probable they “skip” raising in June but leave the door open for more hikes if Inflation continues to be stubborn. That leaves more uncertainty and unanswered questions, and what the market decides to do with that is yet another unknown.
I do know the data says there are certain areas of the economy already in recession – Manufacturing is at the top of the list, and others (select retail) are weakening and could soon follow. While the tech sector looks like it wants to go higher the retail sector looks like it wants to visit the 2020 lows. That typifies the divergence all around us. I’ll add that eight of the eleven sectors are down for the year, and that leaves me hard-pressed to start pounding the table for an extended BULL market run.
Instead, this is the time to take what the market divergence is giving. Use the momentum and wait for select opportunities.
The Fed And Interest Rates
There still may be more work to be done to get inflation to the target level.
Stephen Slifer, NumberNomics:
The point is that the calculation of whether interest rates are “too high” or not depends upon exactly what interest rate one is using, and the inflation measure one chooses. The only fair way to make that evaluation is to look at several measures. There is no magic answer. The best one can do is get a general sense of where interest rates are today versus where they should be. Our conclusion? The funds rate and other market rates still need to rise by 0.75% or so to have a reasonable chance of slowing the economy enough that the inflation rate will return more quickly to its 2.0% target.”
The Bottom line; investors are laboring with two different backdrops. The “outlook” may not be terrific, however, the market will use the oxygen provided by the introduction of AI, to show that the next “quarter” (or more) might be not as worse as originally feared. That will prove to be enough to selectively pick up stocks among the hard-hit value indexes where dividends abound and cash flows are solid. At the same time offer opportunities to follow momentum that can add additional profits for those that are astute at “trading”.
The Week On Wall Street
The S&P entered the trading week on a three-week winning streak, while the splurge into technology stretched the NASDAQ’s weekly winning street to six. It was a quiet week on the market, economy, and policy fronts, as the S&P churned just under the 4300 level. The BULLS were saying the S&P is biding time before it makes a move above 4300, while the BEARS boasted that the index can’t take out resistance and is ready to pull back. Each side has a decent argument and that left the short term in question.
The theme, for now, is “rotation”. The NASDAQ showed its first sign of weakening, as the Russell 2000 showed its first sign of life in a while. More give-and-take sessions, but it was noteworthy that some of the HOT Tech names (semis in particular) gave up gains only to claw back and post wins for the week. As noted, the tech momentum into going to dissipate quickly. Money rotated to the Regional banks and some select industrial stocks. The HOT trades Amazon (AMZN) and Google also pulled back. None of this is unusual, and I expect to see more rotation into some of the laggards that are still NOT extended.
Sideway action kept the S&P in a very narrow 61-point range all week. The S&P 500 made it five weeks in a row with gains, while the NASDAQ weekly streak goes to seven. The Small caps have quietly posted gains in the last four straight weeks and although the DJIA still lags, it has put together back-to-back weekly gains.
The Economy
The SERVICES sector of the economy remains in expansion.
The seasonally adjusted final S&P Global US Services PMI Business Activity Index registered 54.9 in May, up from 53.6 in April and broadly in line with the earlier released ‘flash’ estimate of 55.1. The latest upturn in business activity was the fourth successive monthly increase, with the pace of expansion accelerating to the steepest since April 2022.
US Services (www.pmi.spglobal.com/Public/Release/PressReleases)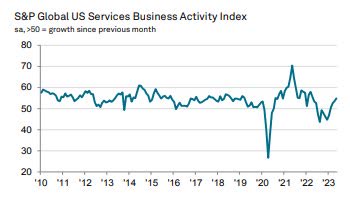
ISM services index dropped 1.6 points to 50.3 in May, missing estimates, after edging up 0.7 ticks to 51.9 in April. This is the weakest since December’s 49.2, but it has remained in expansionary territory for a fifth straight month. And except that contractionary print from December, the index has been above the 50-mark since May 2020.
Employment
Now that economists have had time to dissect the May jobs report released last Friday, they uncovered a confusing scene. For the 14th consecutive month, the headline figure of the monthly jobs report was HOT. Nonfarm payrolls in May soared by a stronger-than-estimated 339,000 jobs, compared with the expected consensus increase of 195,000 jobs.
When they looked under the hood of the overall jobs scene it was a different story. Household employment, the metric on which the unemployment rate (U-3) is based, plunged. It shed 310,000 jobs in May following gains of 139,000 in April, 577,000 in March, and 894,000 in January. That is why unemployment rose from a low of 3.4% in April to 3.7% in May, the largest 1-month increase since April 2020.
Hours worked slipped a tick in May to 34.3, which is expected as employers typically cut hours before they start to cut jobs. With more than 80,000 layoffs in May, the Challenger Job Cuts Report rose nearly 20% month-over-month (m/m) and almost 287% year-over-year (y/y), with technology terminations accounting for more than a quarter. Average hourly earnings continue to decline, sliding to a gain of 4.3% y/y in May, down from 4.4% in April, 4.7% in February, and 4.8% in December 2022.
This past week Initial jobless claims rose to a 20-month high, indicating the Fed rate hikes may be starting to affect the overall economy. The one statistic that no one is talking about is “real wages” (wages after inflation). They are now down for the 25th straight month and that has never been seen before in US history. At some point that is going to matter, and like everything else investors face, here is another mixed bag to try and sort out.
The Global Scene
Global Services PMIs were released this week.
The J.P. Morgan Global Composite PMI Output Index rose to 54.4 in May, up from 54.2 in April, to signal expansion for the fourth month in a row. The service sector outperformed manufacturing again during May, with the growth of services activity accelerating to its best since November 2021. Although the growth of manufacturing production was subdued in comparison, the rate of expansion still improved to an 11-month high.
Global PMI (www.pmi.spglobal.com/Public/Release/PressReleases)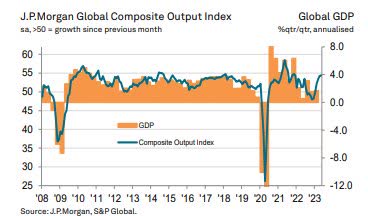
The UK
The headline seasonally adjusted CIPS UK Services PMI Business Activity Index posted 55.2 in May, down slightly from 55.9 in April but above the neutral 50.0 value for the fourth consecutive month. The latest reading signaled a strong rate of business activity growth that remained faster than the long-run survey average.
UK PMI (www.pmi.spglobal.com/Public/Release/PressReleases)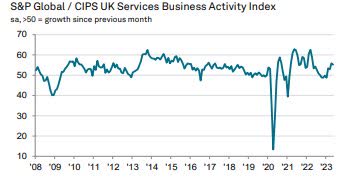
Eurozone
With GDP revised down for Q1, but also for prior quarters, the Eurozone is now in a mild recession.
Euro growth slows to a 3-month low as Manufacturing drags down the ‘composite’ results.
Eurozone PMI (www.pmi.spglobal.com/Public/Release/PressReleases) Euro Composite PMI (www.pmi.spglobal.com/Public/Release/PressReleases)
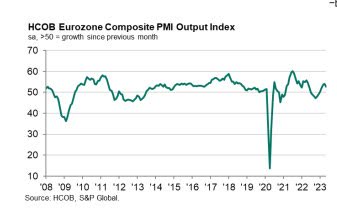
Another sign of manufacturing weakness in the Eurozone.
German Factory Orders dropped 0.4% month-over-month in April vs. the 3.8% expected. Overall factory output tumbled 9.9% Year over year in April vs. -8.4% expected.
China
The Caixin China General Services Business Activity Index increased from 56.4 in April to 57.1 in May, to signal a sharp and accelerated rise in services activity midway through the second quarter. Furthermore, the rate of expansion was the second-steepest seen over the past two and a half years. Business activity has now increased in each month since the start of 2023.
China PMI (www.pmi.spglobal.com/Public/Release/PressReleases)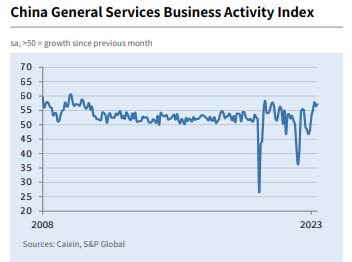
India
Posting 61.2 in May, India Services PMI Business Activity Index highlighted a further expansion in output across the sector. Despite falling from 62.0 in April, the latest reading indicated the second-strongest rate of growth in just under 13 years. Favorable demand conditions, new client wins and positive market dynamics reportedly supported output.
India PMI (www.pmi.spglobal.com/Public/Release/PressReleases)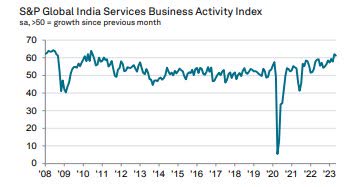
Japan
The headline au Jibun Bank Japan Services Business Activity Index rose from the previous peak of 55.4 in April to 55.9 in May to set a fresh series record expansion in services activity. Anecdotal evidence suggested that the increase in customer demand was sustained as the impacts of the COVID-19 pandemic continued to wane.
Japan PMI (www.pmi.spglobal.com/Public/Release/PressReleases)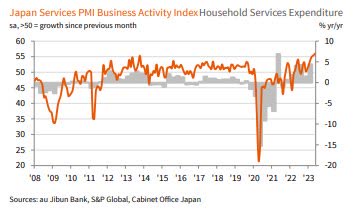
ASEAN (Manufacturing)
The ASEAN Manufacturing Purchasing Managers’ Index printed above the no-change 50.0 mark for the twentieth successive month in May, to signal a sustained improvement in operating conditions. However, the latest reading of 51.1, down from 52.7 in April, pointed to only a marginal rate of growth that was weaker than seen on average over the current sequence of expansion.
Aesean PMI (www.pmi.spglobal.com/Public/Release/PressReleases)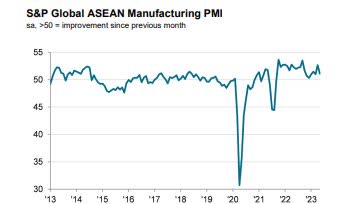
The FED
The Federal Reserve has already hiked the Fed funds target range at ten consecutive meetings over the past 14 months, bringing it to 5-5.25%. Most expect it will leave the range there at its upcoming policy-setting meeting on June 14. But the core Personal Consumption Expenditure (PCE) Index, the Fed’s preferred measure of inflation, rose a tick higher in April to 4.7% y/y.
That means the June 13th release of the core Consumer Price Index (CPI) print for May will be critical to its decision-making. Depending on the data, it could potentially re-engage with a quarter-point hike at the July 26 meeting.
I continue to believe the “market” is way offside in the current Fed Futures pricing in rate cuts at the end of this year. If the Fed proceeds with the “skip” strategy while leaving the door open for further hikes down the road, it could be called “risky”, “sensible”, and “confusing” -and ALL would apply. That shows how delicate this inflation interest rate scene is.
Food For Thought
This may be a shocker to some, but I am not surprised at all.
GM (GM) CEO Mary Barra says that she doesn’t see profitable electric cars in the $30,000 to $40,000 range until the end of the decade or “maybe even later.”
This is just the latest in a series of forecasts that keeps pushing the profitability of “EVs” out further and further. If she is correct that another 7-8 years before an EV is profitable.
I’ve stated the facts before and nothing has changed. The current PUSH to go electric is deeply flawed. These types of headlines are confirming that. The problem is this won’t be just an auto industry problem – all of the other moving parts that go along with this transition will cause economic disruption, and it won’t be positive. Yet no one is listening cause it’s considered “acceptable” to be financially irresponsible for a “cause”.
This brings into question the financial validity but also the timing of the EV transition. The PUSH to eliminate gas-powered vehicles in favor of electric is singularly focused and dismisses all of the other factors that are involved in the transition. It’s not only the financial aspects that are at risk. We’ve already heard experts say the mining required to provide the required materials will be physically impossible to accomplish in the next decade.
When the EV revolution first started, I reported that Toyota was the only large automaker that would continue to produce Hybrid vehicles. In my view that was the “natural” progression in the transition. When Toyota announced that, the “others” announced they were “all in” on “electric”. In an article that didn’t make the light of day because it is considered unpopular, the CEO of Toyota reported there is a growing number of automakers that now doubt the EV-only approach.
This isn’t about being anti-transition or anti-EV, this is all about a MANDATED transition that is going to create economic upheaval that will negatively impact the entire business world. That is IF this transition ever gets anywhere close to projections.
One last point. If one of the largest automakers GM says they won’t make a profit on EVs until at least the end of the decade, what does that say for the other fringe players? How many billions will be tossed at this endeavor, that many experts say will make no difference to global emissions? In the interim, squelching investment in oil and gas today, will have major global economic ramifications tomorrow.
The Daily Chart Of The S&P 500 (SPY)
Five successive days where the index was flat finally led to a small break higher, but the S&P is still in search of a close above the 4300 level.
S&P 500 (WWW.tc2000.com)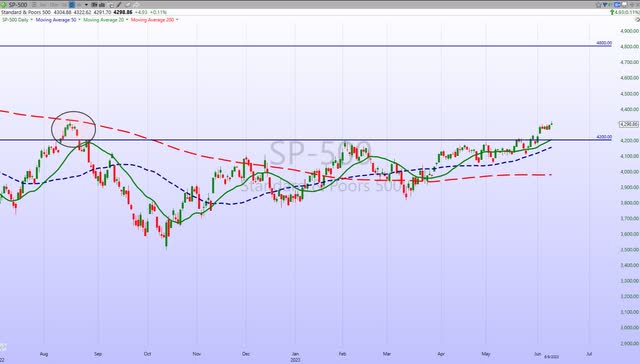
Perhaps it comes next week, but the August closing high of S&P 4305 also remains an elusive target. This makes the present technical scene very interesting. A failure here that sets off a pullback, can be construed as a “Double Top” and that wouldn’t bode well for the intermediate term.
What makes matters worse is the fact that the indices have already used up plenty of buying energy to get to these levels. Levels that are now bordering on extremely overbought in the short term.
The 2023 Playbook Has An Expanded Playing Field.
With Momentum and “GREED” driving the technology bus, we can easily conclude that these two indices could move higher. However, the more extended these two indices get, without a pullback, the sharper the next drawdown. Let’s move on to the index we spend the most time discussing – the S&P 500. The index has rallied and simply reached the target zone many (including myself) had projected – S&P 4300. This target has been discussed for months. So this rally in the S&P 500 should NOT be a surprise. No need to go over all of the reasons why everyone had this zone in mind, but suffice it to say- here we are. What has been more surprising is the action in Technology.
What happens NEXT is more important than what has occurred up to this point.
The S&P and DJIA have now joined the NASDAQ and NASDAQ 100 in boasting a more positive BULLISH pattern. All four are now trading above their Long term trend lines. Investors have to respect that price action, especially in the NASDAQ and NASDAQ 100 because after they first broke the downtrend in April, they extended their breakouts in MAY.
We’ll now have to see if the same occurs with the DJIA and S&P 500. In addition, we now have 10 sectors and sub-sectors that have also broken the BEAR trend.
What all of this means and more importantly how an investor proceeds now is the dilemma. Last year it was Energy in a bullish trend and other than Healthcare – nothing else came close to breaking out of its respective BEAR trend. This time around Technology has keyed a change in not only their indices and other key subsectors as well.
Before we go any further every investor has to realize how much emotion plays into the price action. Depending on the sentiment that exists, markets can extend any move both on the upside and the downside. It is NOT uncommon for any stock, sector, or the entire market to overshoot a target zone. Markets can, and do, get “stretched” in both directions due to TWO things – FEAR and GREED.
Small Caps
Money rotated into the Russell 2000 small cap index (IWM) sparking a 1.6% weekly gain. Unfortunately that brought the index right up against formidable resistance. The fact that the Russell 2000 reached its most overbought reading in HISTORY this week. (3.75 standard deviations above its 50-Day MA), the probability that the group pulls back and remains rangebound is fairly high.
Sectors
Consumer Discretionary
The sector continues to show strong momentum. The Discretionary ETF (XLY) has added another 6.3% this month bringing its 2023 gains to 24+%. Like many other areas of the market, it is very much extended in the near term.
Energy
The Saudis’ decided to make a move on their own and cut oil production by 1 million barrels/day starting in July to stabilize prices. Saudi Arabia will now produce 9 million barrels of crude oil per day. That’s 1.5 million fewer barrels per day than it was churning out earlier this year.
Another week goes by with the Energy ETF (XLE) hovering above long-term support. It has followed the price action in WTI which was able to stabilize in the low 70’s this week. I continue to HOLD my positions
Financials
The beleaguered Financials (XLF), which have been struggling, remained steady and sideways. Therefore, we can currently eliminate the possibility of a crisis scenario.
The same can be said for the Regional Bank ETF (KRE). We started to see more money roll out of tech and into the regional banks this week, and it will be interesting to see how long this trend lasts.
Over the past weekend, I issued trade alerts for select names in the group. There is plenty of room to pick up a decent short-term gain before technical resistance is met. Momentum is back. The KRE posted a seven-week high this week extending its weekly winning streak to four.
Healthcare
The healthcare sector (XLV) is one area of the market scene I thought would attract money as it left the HOT trades. So far that has not been the case. The group remains in more of a “give and take” trading pattern. I added to my healthcare exposure this week.
Biotech
The trading range has been established and for the most part, has been respected. The ETF (XBI) is now testing the upper bands of the range. That has the sector trading above (just barely) its longer-term moving average for the first time since October 2021.
The trading range has been established and for the most part, has been respected. The ETF (XBI) is now testing the upper bands of the range. That has the sector trading above (just barely) its longer-term moving average for the first time since October 2021.
Gold/Silver
With all the attention on Technology, my objective is to look elsewhere for other opportunities that most everyone else is overlooking. I expect this money rotation may have more to go.
I’ve mentioned recently that I find the metals interesting but as noted last week, I wasn’t so sure we have seen the ‘low’ in this recent move made yet. I still like the setup in the metals and think they could make another move higher this year, but support has to HOLD around these levels.
With Tech still dominating the headlines, the general feeling now is that the precious metals will settle into a trading range. Use a call option strategy to set up a position and add income, while you wait for a bigger move.
Both (GLD) and (SLV) remain in a long-term BULL pattern.
The Gold miners (GDX) (GDXJ) have the same look and long-term players might be interested in looking at a low-risk, high-reward setup here. The VanEck Vectors Junior Gold Miners ETF is in the middle of its trading range while its RSI indicator is getting down near where it bottomed out in February. It appears to have quite a few similarities to that late February/early March period, right before GDXJ shot up 36% in the next month or so.
Uranium
Uranium (URA) continued to rally this week as if it was a tech stock adding 11+% in the last seven trading days. URA is also in a Long term BULL trend and continues to be a favored position in my portfolio.
Technology
NVDA Slides into TSLA’s Role of Bubble Stock That Every Growth Manager Must Own.
NVDA is a great company with tremendous growth potential, I’ve owned it as a CORE holding for years. However, after the parabolic run, it made in late 2021 and the severe sell-off it experienced last year, I thought the odds were pretty darn good that it had seen its high for a very long time. I was wrong!
The recent price action will likely be remembered for years to come. With a P/E over 200x times earnings and a P/S over 36x, it is probably the most overvalued mega-cap stock in history. It’s also incredibly extended – about FOUR standard deviations above its 50-day moving average.
I expect NVDA is going to retrace a significant portion of its recent rally eventually, but, again, these parabolic bubble moves don’t follow any rules so I cannot tell you when that will begin. I can tell you, however, that I have no interest in buying it here. I can recommend the strategy employed recently. BUY the stock and take advantage of the wild call option premiums and sell a 3-4 month call against the position.
For those that do not wish to follow that strategy, then simply sit back and WAIT for what will at some point be a huge retracement. If you doubt that will ever occur, then just go back to the ’21-’22 time period where we saw the stock trade down to $109 from the former all-time high of $333. ALL stocks eventually revert to the mean.
Unless you are a very astute trader, chasing parabolic moves ALWAYS ends badly. BE PATIENT on any stock that has posted an outsized move recently.
Semiconductors Sub-Sector
The rally in NVDA and others has pushed the Semiconductor ETF (SOXX) right up against a zone that posed resistance in early 2022. Like many of its components, the SOXX is now quite overbought so it would be normal to see some sort of retracement in the near term, though the overall chart has taken on a better look now.
Since the semis are a very important indicator the notion is this breakout portends good things for the rest of the market.
Final Thoughts
As noted earlier, the month of MAY has brought about that change in how we now have to view technology and technology-related stocks. I’ve laid out the reasons why we shouldn’t be chasing here, but it’s now clear that for the INTERMEDIATE term, 2- 3 months or so, pullbacks in Tech are to be bought.
Looking at the DJIA chart, note the strong rally from October to year-end. Then compare that with the chart of the NASDAQ and NASDAQ 100 in that same period. It was TWO completely different markets. We now have the direct opposite. Technology has gone parabolic and the DJIA up to this point has been flat. In the next month or so I expect that to level off, with technology slowly weakening and working off the gains, setting off a money rotation into other sectors that have been “flat”. We may have seen the first signs of that this week. That does NOT mean tech will crumble overnight. That is highly unlikely given the strength and momentum behind this move, and it is why I suggest adding more “trades” on PULLBACKS.
In the intermediate term, the upside looks more limited for some indices (Technology related) while others (DJIA/Small caps) have more room to move higher. Either way rational portfolio construction involving stock picking has been and will continue to be extremely difficult. The reason; nothing has changed in the way I am viewing the MACRO scene. For a long while now I have written that the region centered around 4300 would be a probable target for the S&P 500. The market must still navigate some clear headwinds to enjoy significant gains and the resistance zone around 4300 is going to be a huge test.
If the S&P proves that it can climb above this zone and stay above this zone, while also doing enough to convince me that the balance of evidence is getting better, then I have no problem saying this is a new BULL market that is going to set new highs. We are not there yet.
However, what has changed is the near-term view that can offer more opportunities. The playing field has been opened up. I can have more confidence in sectors that are in defined BULL trends even if they (technology) may weaken due to overbought conditions. It’s similar to how I played the Healthcare sector in the last year or so.
I never get overly concerned if I miss an initial move, especially in a sector that is still in a downtrend. If the move is indeed real, then pullbacks that are well-contained will be opportunities to then ACT with CONVICTION.
THANKS to all of the readers that contribute to this forum to make these articles a better experience for everyone.
Best of Luck to Everyone!
Read the full article here


