Produced by Jason Appel, with Avi Gilburt and Ryan Wilday
From June of 2022, we published a trio of articles (3 Alts With Setups For Higher Highs In the Next Bull Cycle in Crypto) providing detailed thoughts on Binance Coin (BNB-USD), Polygon (MATIC-USD), and Aave (AAVE-USD). This article will review the calls from the past year and provide detailed thoughts on prospective bullish paths for BNB and MATIC. In the case of AAVE, while the setup discussed in its August 2022 update has not invalidated, its progress since then does not inspire confidence for the bullish prospect that was presented and a lower low down to the $22-$25 region cannot be ruled out.
First, it’s wise to take a look at Bitcoin (BTC-USD). In the Elliott Wave analysis, we endeavor to consider each chart on its own and while a broad array of Cryptos are developing relative independence from the price movements in Bitcoin, this has not yet proven to be a durable feature of this nascent class of assets. As such, we’d be remiss not to review where the price of Bitcoin is in context for larger expectations. From my recent Bitcoin update from late March of this year:
“With all that’s transpired, though I can’t rule out a lower low [beneath the 2022 low] (which will be discussed), the primary interpretation of this action from November is an initiation move of sorts [to new all-time highs].”
To clarify: the action from the 2022 low has not yet confirmed resolutely a completion of the bear market. Price still has $32k-$48k resistance to contend with, but the pattern off the lows offers reasonable indication to be tentatively in favor of a completion to the bear market.
BNB
In the past few weeks there have been numerous headlines which would appear to be bearish for crypto. The SEC has filed lawsuits against both Coinbase (COIN) and Binance, two of the world’s largest Cryptocurrency Exchanges. And while there’s been an uptick in volatility and a downturn in both Coinbase shares prices and BNB price, both have come in to their larger support regions and the crypto market as a whole has not really blinked
From the BNB article:
“The breakout in February of 2021 marked the start of what’s typically found to be the strongest most directional portion of a trend, known as “the heart of the third wave.” In this case, Minor 3 of Intermediate (3) of Primary (circle) 3. Since the May 2021 high, price has pulled back substantially in percentage terms, but note on the chart, the high consolidation, ie, BNB has retraced a very small portion of the wave 3 advance and price is range-bound near the upper end of the whole wave 3.”
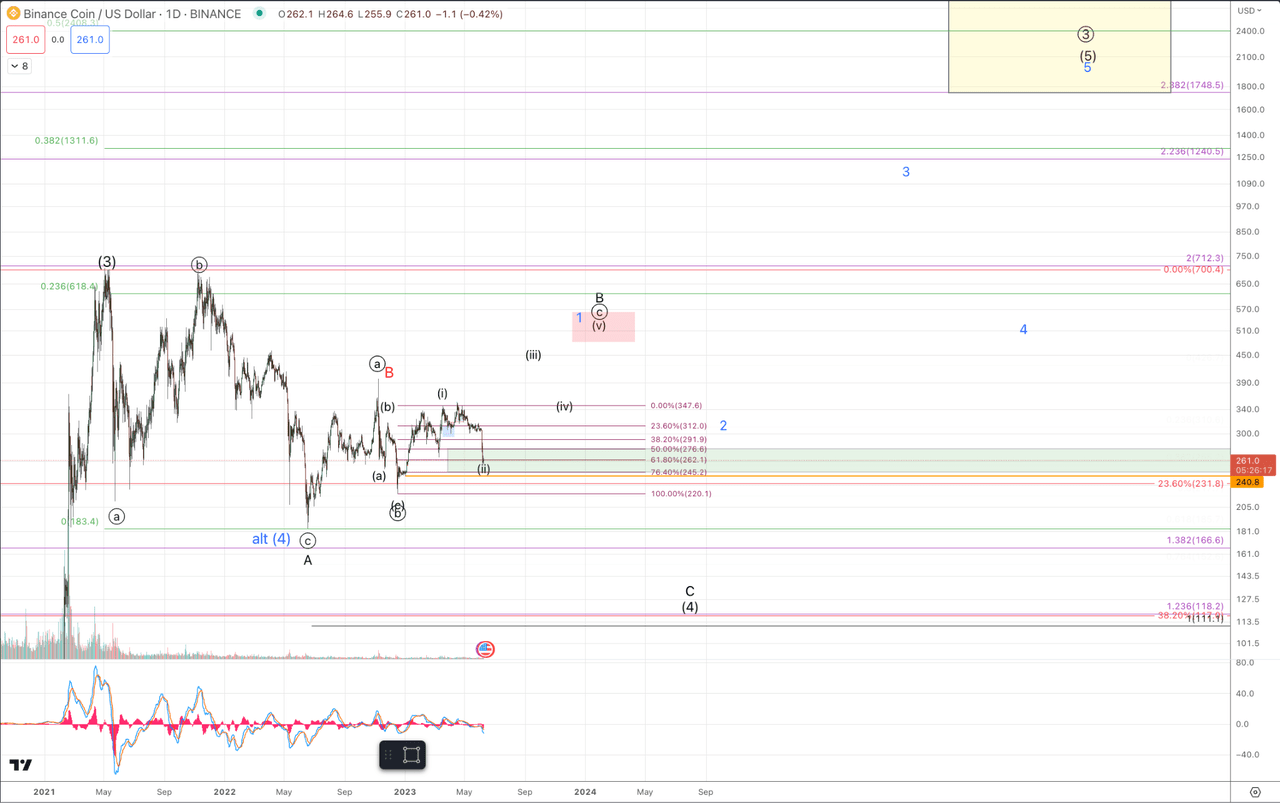
Given the protracted sideways action, I have slightly shifted perspective to considering a higher degree (3) having completed. However, this does not change expectations for a very bullish outcome over a multi-year time horizon as BNB continues to maintain well above necessary Fibonacci support. Unlike Bitcoin, BNB does not display a pattern that offers confidence to consider a lasting bottom in place, but the current action does present a very favorable short term trading setup with an outside prospect of it turning into a much higher yielding swing trade.
The primary perspective currently, shown in black, is that price is still within a corrective pattern and in this interpretation larger degree support ranges down to $100-$120. While this displayed path does not clearly present a very bullish buy and hold outlook for the next several months, there are some individual discrete trading opportunities that have arisen on the smaller time frame.
Regarding BNB, price is within support for a favorable long entry. Micro support is in the $245-$277 region and as of writing this, price is hovering in the middle of that zone at $264 and looks to be setting up for another drop down to $250~.
The upside target for wave (III) in this pattern is $400-$460, followed by a corrective retrace in the wave (iv) and then one more high to complete the B wave, targeting $480-$575.
So long as price keeps from making a meaningful break below $240, the short term expectations remain for a bullish resolution from this current pullback.
From the ultimate $480-$575 region, given the corrective formation up from the 2022 lows, expectations are for another leg down to complete the wave (4). That said, my secondary alternative path shows the prospect that price makes its way up to the larger degree target region but in an ending diagonal pattern.
In either case, given the short term setup, BNB offers an interesting trade from a risk/reward perspective that has the opportunity to run to new all-time highs. The technical setup aside, please be mindful of the heightened risk based on the SEC lawsuit.
For those concerned about the longer-term expected path: The expectation is that price can drop from the B wave target ($480-$575) down to the $100-$120 region to complete a very elongated wave (4) and then head up to new all-time highs. Note, my adjusted target region for the wave (5) – whether price heads there in more direct fashion as per the blue count or in more circuitous fashion as per the black count – is $1750 all the way up to a whopping $7500 with an ideal target between $2100-$3700.

Jason Appel (Crypto Waves)
MATIC
Of the three altcoins written about here last summer, MATIC has fared the best by a long shot. Even with MATIC’s large pullback from the February 2023 high, it is still up over 70% since we presented it here on July 6th of 2022. And at the February peak, price was up about 200% from the price at publication.
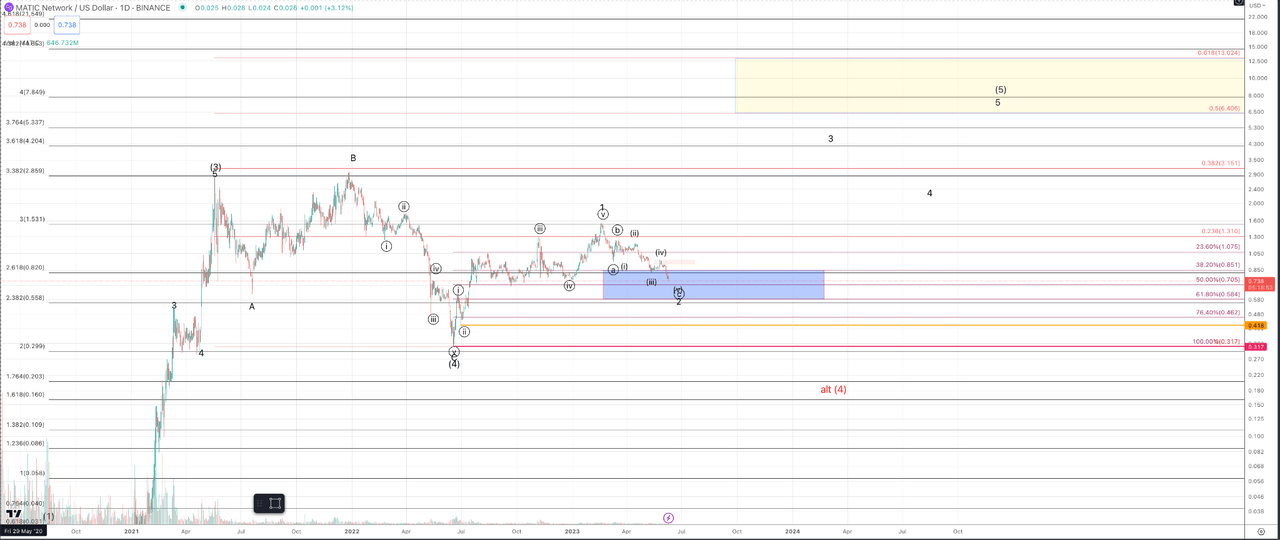
Unlike BNB which has moved up in a corrective pattern from the 2022 low, MATIC has managed to rally in a 5 wave formation from into the February 2023 high. This is very suggestive of a completed wave (4) and price starting the wave (5) up to new all-time highs. We note in Elliott Wave analysis that an initial 5 wave pattern in the direction of a larger trend that occurs at the completion of a corrective, countertrend, 3 wave pattern signals an initiation move for the next cycle in the trend, in this case bullish.
Though MATIC’s rally from the 2022 low into the February 2023 is somewhat irregular. The overall pattern is “textbook” from an Elliott Wave perspective and portends a big breakout coming.
The lower end of this target region, $4.19, represents the prospect of a weak wave (5). However, supposing this (5) finds support in the standard region $0.54-$0.85 and then continues upward in impulsive fashion, we will keep our attention on the $6.40 to $13 region. Clearly, $13 offers a much bigger gain than $4.19, but as price rises into the target region, the risk/reward ratio begins to deteriorate and we encourage good risk management practices among all our members at Crypto Waves. Even considering the lower end of the target region, a long entry in support offers a well-defined setup with a strong risk/reward ratio
On the micro level price has enough waves to consider the downside pullback to be completing but a rally over $0.97 will be needed to suggest with some confidence that a low in wave 2 has been struck.
In order for the thesis of this trade to remain within reason, price should get no sustained break beneath $0.40. While technical invalidation of the thesis does not occur until a prospective break below $0.31 develops, below $0.40 on a sustained basis would jeopardize the upside potential that’s shown within this setup. Even with a large percent risk to the downside from current support, the overall risk/reward skew with a great technical setup is favorable in the current region.

Jason Appel (Crypto Waves)
Editor’s Note: This article covers one or more microcap stocks. Please be aware of the risks associated with these stocks.
Read the full article here


