Headline
In my search for safe, sustainable, and sizable dividend yields, my hunt normally leads me to the dividend aristocrats. Good ideas within this spectrum are usually garnered by searching the Pro Shares S&P 500 Dividend Aristocrat ETF (NOBL) list. I chose not to buy the fund outright, as I like to allocate my aristocrat portfolio more like a Dow Dogs list, looking for good deals within the top 10-15 yields. For that reason, I really like the Schwab US Dividend Equity ETF (SCHD). Sometimes good dividend growth ideas pop up that are not within that list because they have not yet met the 25-year standard of dividend growth.
One of these stocks that has caught my eye is Amgen Inc. (NASDAQ:AMGN). They are a DJIA 30 component and are within the Dogs of the Dow top 10 yields. Many of the Dogs have some questionable sustainability of the dividend. I am not seeing that with Amgen Inc. I own this stock because I self-index the DJIA 30 as a beta strategy. I have not purposely purchased this stock in larger-than-index matching sizes. The stock looks like a buy at this price and yield, let’s take a look.
The chart
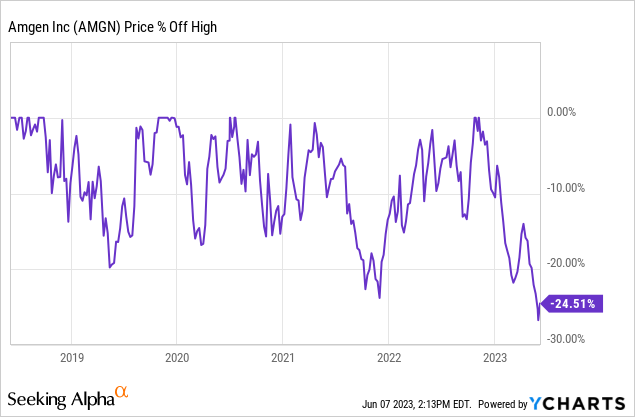
Down 24.51% from the all-time high, Amgen is in a bear market within the index. It has not been obliterated, but has taken a nice dip. I love to examine stocks that are at least 20% off their highs. Amgen Inc. fits the bill.
What they do
From the 10-K:
Amgen Inc. (including its subsidiaries, referred to as “Amgen,” “the Company,” “we,” “our” or “us”) is a biotechnology company committed to unlocking the potential of biology for patients suffering from serious illnesses by discovering, developing, manufacturing and delivering innovative human therapeutics. This approach begins by using tools like advanced human genetics to unravel the complexities of disease and understand the fundamentals of human biology.
Amgen focuses on areas of high unmet medical need and leverages its expertise to strive for solutions that improve health outcomes and dramatically improve people’s lives. A biotechnology pioneer, Amgen has grown to be one of the world’s leading independent biotechnology companies, has reached millions of patients around the world and is developing a pipeline of medicines with breakaway potential.
Clients and sales
Amgen 10K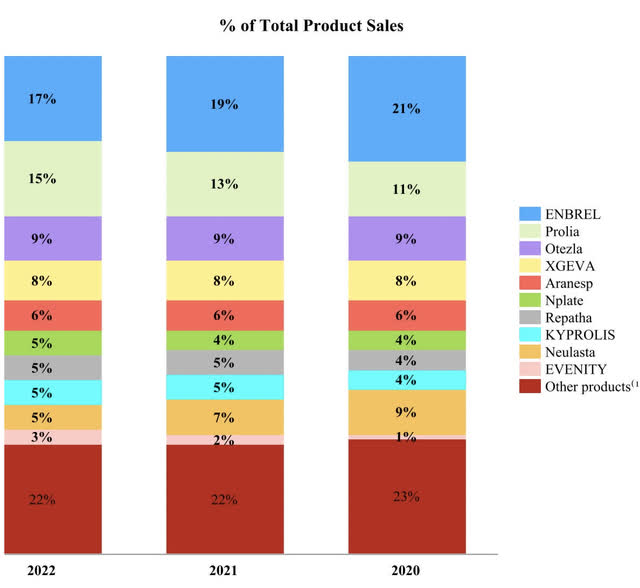
As a product mix, Amgen Inc.’s Prolia osteoporosis treatment seems to have the most growth with the still current sales leader, Enbrel, declining. Amgen Inc. offers such a multitude of treatments that almost a quarter of the sales are allocated to the “other products” category. This is about as diverse a biotech/pharma company as you can find.
Territories
Amgen 10K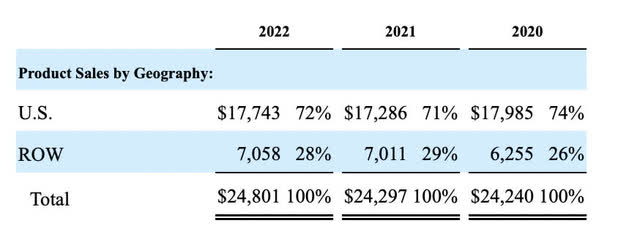
With 72% of sales coming from the U.S., this is a U.S. economy-centric story. With the winding down of Covid, almost all medical-related sector stocks are being pulled down as a whole. This is a great opportunity to find the best operators with the greatest margins.
Valuation models
Based on Gordon Growth Model
This dividend discount model, created by MIT professor Myron J. Gordon, will find the price target for the stock by discounting the dividend by the required rate of return, RRR, minus the 5-year dividend growth rate. We’ll then reduce that price by another 15% as that was the minimum margin of safety indicated by Ben Graham and Warren Buffett. In this case, I want a required rate of return higher than the market, since this is not a dividend aristocrat and the dividend is not a proven bi-product of the investment.
- Dividend $8.52
- 5 year growth rate 10.5%
- RRR 13.5%
- $8.52/13.5%-10.5%=$284
- $284 reduced 15%= $241
Owner earnings discount
A valuation of a company based on owner earnings, which is net income plus depreciation and amortization minus CAPEX discounted at the risk-free rate, needs an addition for biotech. Both biotech and semiconductors require R&D for their existence, rather than a growth engine. Therefore, in these two sectors, I am also deducting R&D expenses the same way I would CAPEX.
All numbers in millions; all data courtesy of Seeking Alpha.
- TTM Net income of $7,917
- Plus TTM depreciation and amortization of $3,476
- Minus $1,090 TTM CAPEX
- Minus $4,533 of TTM R&D
- Equals owner earnings of $5,770
- Discounted at 10 year treasury 3.79%= $152,242.74 fair market cap
- Divided by 543.3 mil shares outstanding = $280.21
- Short risk-free rate 2 year treasury 4.55% discount = $126,813.18 fair market cap
- Divided by 543.3 mil shares outstanding = $233.41
- Blended fair price of long and short discounts =$256.5
Taking the average of both my dividend discount model and owner earnings model would leave us at a fair price target of $248.75.
Balance sheet trends
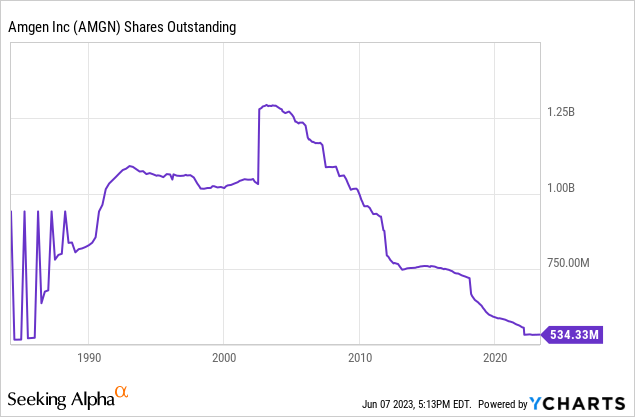
Wow! Big reduction in shares outstanding since mid-2000. This is close to a 60% reduction in shares since that time. Only companies with big, steady free cash flow and margins can reduce the float like this without tons of debt.
seeking alpha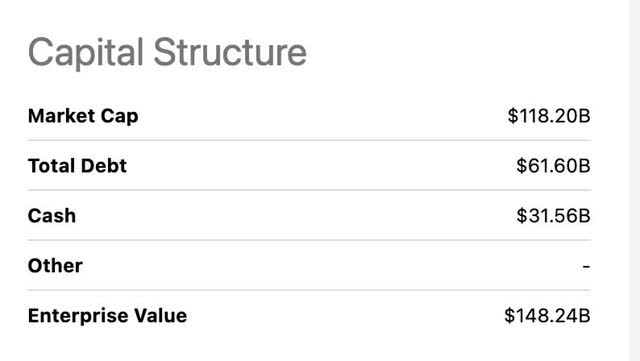
Capital structure looks fairly conservative, with debt making up 51% of the market cap. Cash and cash equivalents are very healthy at $31.56 billion.
Competition & margin trends
seeking alpha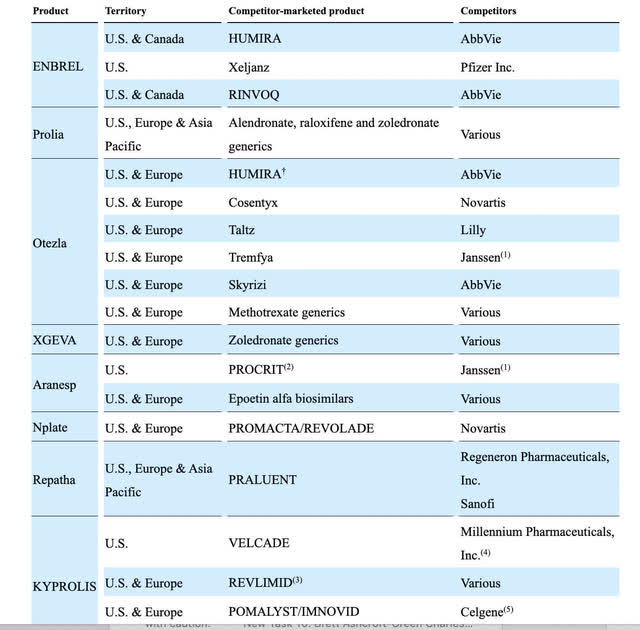
Amgen Inc. has rivals in almost every segment of their product lines. Let’s comp the margins.
Margins
Gross
seeking alpha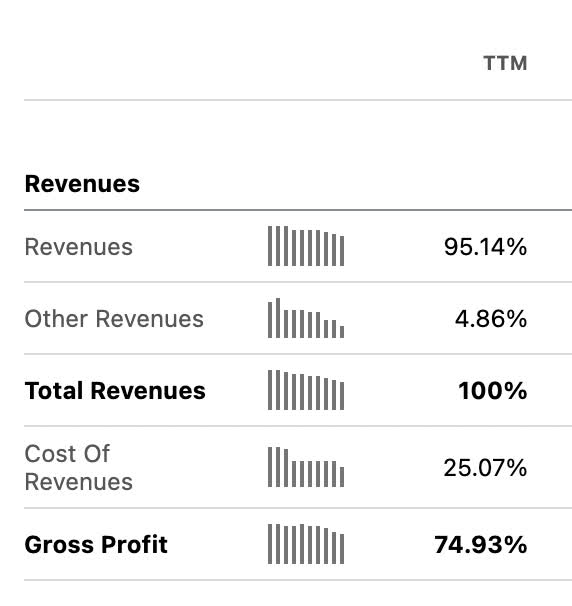
Operating
seeking alpha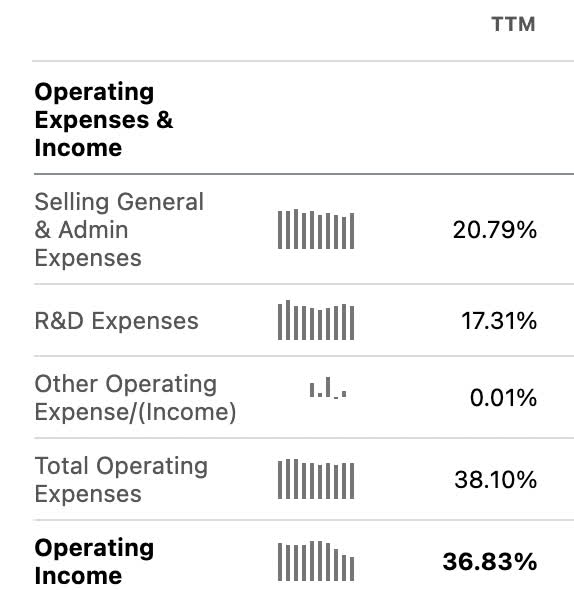
Net
seeking alpha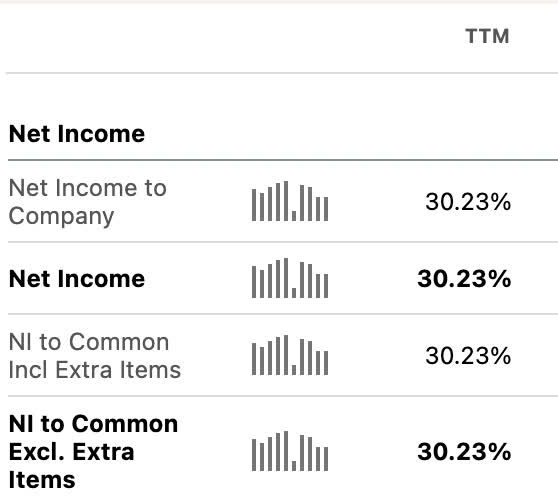
This is one of the most profitable big pharma/biotechs. The 30.23% profit margin is great to maintain a high return on equity profile. The large amounts of cash they generate have contributed to the company’s ability to buy back large amount of shares and raise their dividend substantially.
Let’s compare some profit margins amongst the competition:
| Company | Profit Margin |
| AbbVie (ABBV) | 13.29% |
| Pfizer (PFE) | 31.24% |
| Novartis AG (NVS) | 13.45% |
| Eli Lilly and Company (LLY) | 20.54% |
| Sanofi (SNY) | 18.09% |
| Bristol-Myers Squibb (BMY) | 13.29% |
| Amgen Inc. | 30.23% |
Only Pfizer has a comparable profit margin to Amgen Inc. They both face a decline in the top line but are very profitable in making it cascade to the bottom. When the top line is stagnant, but margins are amazing, buybacks are the best initiative for the growth in EPS and dividends. Amgen Inc. has reduced shares outstanding by about 57% since the mid-2000s. With such a robust margin business, sometimes the best investment is right back into yourself.
The dividend and free cash flow
Seeking Alpha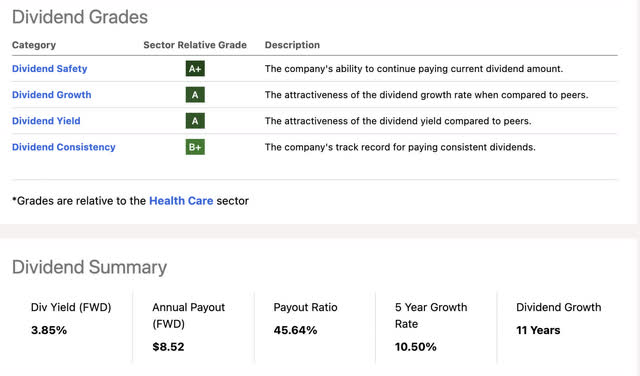
Amgen Inc. has a very attractive payout ratio under 50% with growth for 11 years.
Free cash flow
seeking alpha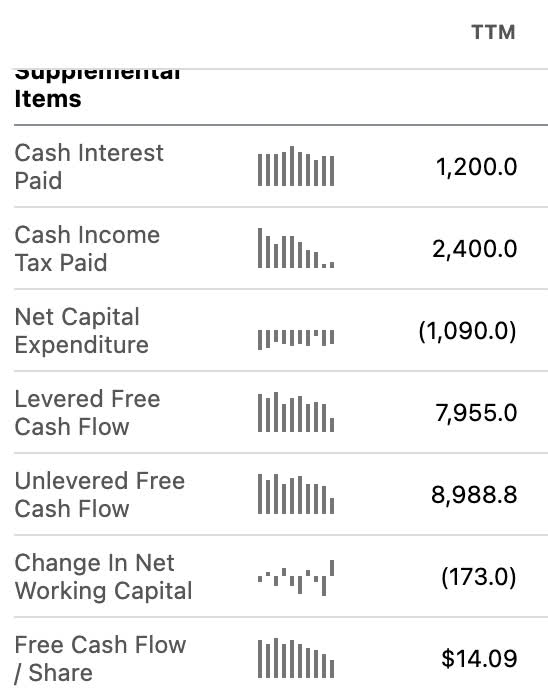
With an annual FWD payout of $8.52 a share and $14.09 in free cash flow per share, the dividend payout is only 60% of free cash flow. Not as good as the EPS coverage, but solid none-the-less.
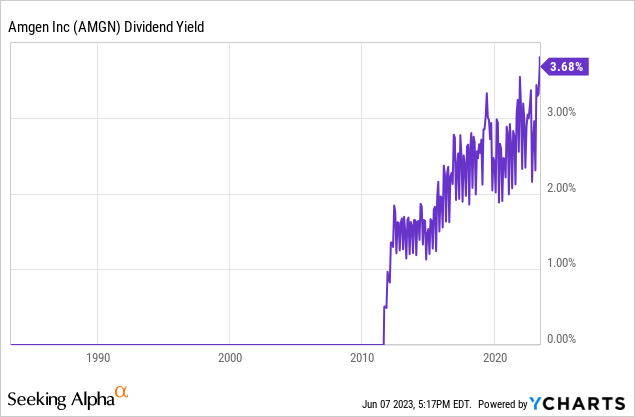
Of course, I would be remiss if I forgot to mention the all-time high yield on Amgen. 3M (MMM) is another all-time high Dow 30 yield as well that I like. This one seems much safer in light of everything happening with 3M, but I like them both all the same.
Risks
Even though the company did not produce a Covid-19 vaccine, part of their recent top line growth was still linked to the ecosystem:
Over the past year, Amgen pulled down $1.682 billion in “other” revenues, a result of its collaboration with Eli Lilly to help supply COVID-19 antibody treatments. In September 2020-anticipating a rush to manufacture and provide its COVID-19 meds-Lilly struck a deal with Amgen to help it produce the antibodies.
With this revenue drying up, the top line may look weak in the year ahead. The well-covered dividend and buybacks will be the main return to investors in the near term and this is a great stock for income investors. Might not be the best for short-term traders. The long-run total return should be able to beat the market in the next 10 years at this entry point.
Total return projection
Growth thesis:
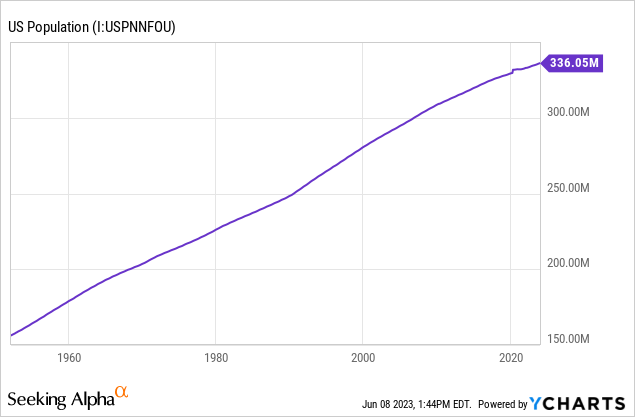
Since we are a country of immigrants, the U.S. has been able to maintain a steady population trajectory. This should continue regardless of the native-born fertility rate. Inelastic economic products such as utilities, drugs, waste removal, etc. grow with population increase. Biotech and pharma are in the inelastic category. The U.S. is one of the best places to bet on inelastic products as we have a top 10 average income per capita worldwide combined with a growing population.
Compound dividend model
Input assumptions:
- $10,000 investment
- 3.85% starting yield
- 9% annual dividend growth (lower than the current 10.5% 5 yr average)
- 5% annual appreciation average
- Shares on DRIP
- 0% tax rate in a tax advantaged account
Tipranks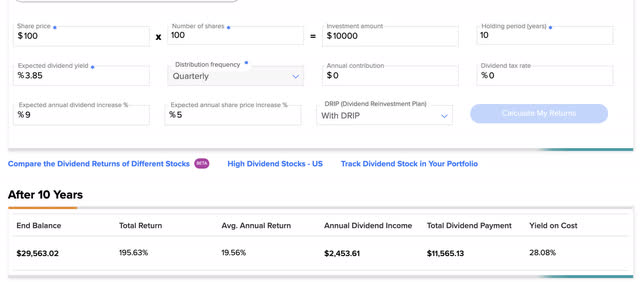
Putting in some pretty conservative assumptions over a 10-year holding period has some nice results. Mind you, this only gives the company an average appreciation of 5% a year for 10 years, lower than average for almost any pharma/ biotech company. This would still yield an average annual return of 19.56% and a total return of 195.63% over 10 years.
Conclusion
This is one of the best income deals in the market considering stocks with ample yield coverage, big margins, and 10+% average dividend growth. The top line looks weak up coming, buybacks should continue to grow EPS. The top line should grow over time with population due to its inelastic nature. The stock is a buy for income investors, just don’t expect it to pop to the upside right away. You should want the shares to languish for a while if you put your dividends on DRIP. This one is a SWAN for sure.
Editor’s Note: This article discusses one or more securities that do not trade on a major U.S. exchange. Please be aware of the risks associated with these stocks.
Read the full article here


