This article headline potentially gives vibes of deja vu after posting Jane’s article titled The Retiree’s Dividend Portfolio, Jane’s March Update: 12 Stocks Generating More Dividends. There is good news and bad news:
Good News – Twelve dividend increases means more money for the portfolio and the majority of these are for stocks that weren’t covered in the Taxable Account or Jane’s Retirement Account articles.
Bad News – With a total of nine new dividend increases (plus the three dividend carryovers from previous March articles) this means that there is a lot of writing and research to do.
In this case, the bad news is actually good news because I can totally accept bad news when it means that my retirees are likely making more money and continuing to strengthen their path for a sustainable retirement.
Background
For those interested in John and Jane’s full background, you can find at least three articles a month published for the last five years detailing the performance of their portfolio. I have continued to evolve the report over time by adding and removing information/images to make the updates more useful to the average investor. Here are the key details that should be understood when reading these updates.
- This is a real portfolio with actual shares being traded. This is not a practice portfolio which is why I include screenshots from Charles Schwab to document every change that is made.
- I am not a financial advisor and merely provide guidance based on a relationship that goes back several years.
- John retired in January 2018 and has collected Social Security income as his regular source of income. John also currently withdraws $1,000/month from his Traditional IRA.
- Jane retired at the beginning of 2021 and decided to begin collecting Social Security early and has not made any withdrawals from her retirement accounts yet.
- John and Jane began drawing funds from the Taxable Account in 2022 at $1,000/month. After speaking with them this amount has been increased to $1,700/month. This withdrawal is still covered entirely by dividend and interest income.
- John and Jane have other investments outside of what I manage. These investments primarily consist of minimal-risk bonds and low-yield certificates.
- John and Jane have no debt or monthly payments other than basic recurring bills such as water, power, property taxes, etc.
The reason why I started helping John and Jane with their retirement accounts is that I was infuriated by the fees they were being charged by their previous financial advisor. I do not charge John and Jane for anything that I do.
The only request I have made of John and Jane is that they allow me to publish their portfolio anonymously because I want to help as many people as I can while holding myself accountable and improving my thought process.
I started this series to address issues I have had when reading other authors with similar types of updates (I am not saying they are wrong, but I found myself questioning their actual performance because they never provided enough information to cover loose ends).
Here is my promise to readers:
- I aim to give as much information as needed so readers can feel confident that what I do is real.
- Even if you agree the results are real this does not mean I expect you to agree with me and I will always answer constructive criticism whenever possible. I will respond with the same genuine intent that the question was asked with.
- I am very transparent about the portfolio and consistency is a significant goal of mine. All of my data points (unless noted otherwise) are derived from month-end statements from Charles Schwab. Even when things aren’t looking great (Spring 2020 for example) you will know because I provide enough information that it would be impossible for me to manipulate.
- This article is not intended to be advice or a call to action and is for informational purposes only (I am not a financial advisor and I don’t claim to be one). My goal is to challenge conventional thinking and empower you to take control of your investments (if that’s something you want to do).
While many authors require paid subscriptions to see their portfolio I do not want to go that route and will continue to publish this series for free as long as there is enough interest to make it worth my time (and I spend A LOT of time on these articles).
Generating a stable and growing dividend income with an emphasis on capital preservation has become the primary focus of this portfolio. I am least concerned about capital appreciation which is why the decisions made will seem pretty conservative most of the time. I may measure the performance of the portfolio relative to indexes and ETFs but the key metric I am focused on is delivering a more stable source of cash flow to John and Jane over time that allows them to live a comfortable retirement that includes minimal stress related to finances.
Dividend Decreases
No companies in John’s Traditional and Roth IRA accounts eliminated or reduced their dividend during the month of March.
Dividend Increases
Twelve companies paid increased dividends/distributions or a special dividend during the month of March.
- Aflac (AFL)
- Avista (AVA)
- CSX (CSX)
- Chevron (CVX)
- Intercontinental Exchange (ICE)
- Main Street Capital (MAIN)
- Masco (MAS)
- Realty Income (O)
- Oshkosh (OSK)
- Prologis (PLD)
- T. Rowe Price (TROW)
- Valero (VLO)
MAIN, O, and TROW were covered in the Taxable Account update or Jane’s Retirement account update. I will only include information about the dividend increases associated with these. Those interested in reading the summary of these three companies can check the links at the end of the article.
Aflac – According to the Q4-2022 earnings call transcript, the March dividend increase represents the company’s 40th consecutive year of dividend increases. Subsequently, AFL also returned $2.4 billion by repurchasing 39.2 million shares which represents approximately 5.5% of the total shares outstanding in 2022. We originally trimmed this position back by a substantial amount when shares were close to $72/share which I considered to be fully valued based on historical results.
AFL – FastGraphs – 2023-4 (FastGraphs)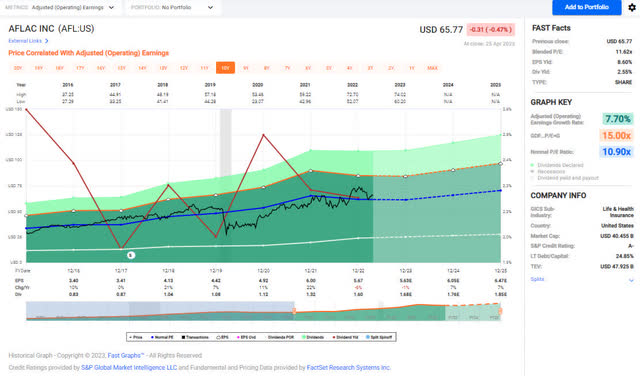
The dividend was increased from $.40/share per quarter to $.45/share per quarter. This represents an increase of 12.5% and a new full-year payout of $1.80/share compared with the previous $1.60/share. This results in a current yield of 2.25% based on the current share price of $81.39.
Avista – AVA’s stock price doesn’t appear to have much upside at this point in time based on a price ceiling of around $45/share that has been in place for over three years. This is also confirmed by the dividend yield which is seen the floor yield of roughly 4% over the last year. The most recent dividend increase represents the 21st consecutive year of dividend increases. Although I believe AVA is a great utility investors would be better off waiting for an entry point below $40/share before adding to or establishing a position in AVA. John & Jane currently have a limit trade open to purchase additional shares under $40/share.
AVA – FastGraphs 2023-4 (FastGraphs)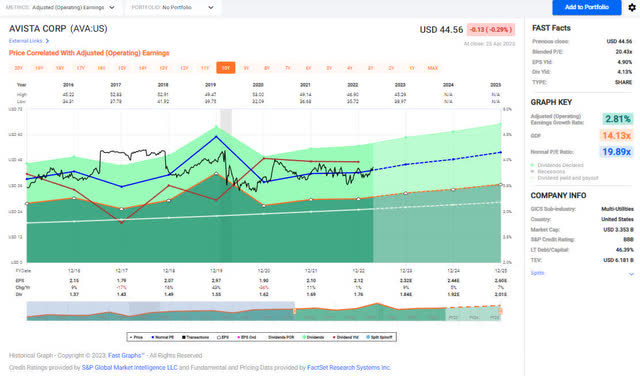
The dividend was increased from $.44/share per quarter to $.46/share per quarter. This represents an increase of 4.5% and a new full-year payout of $1.84/share compared with the previous $1.76/share. This results in a current yield of 4.12% based on the current share price of $44.69.
CSX – We have taken advantage of volatility in CSX stock price to grow the position size in John’s Retirement Portfolio with multiple buys YTD 2023. The position is about as large as it was in the past but the cost basis has been reduced significantly considering the position was established at over $34/share but now has an average cost basis of under $30/share (See image below showing how the cost basis of the position was reduced).
Potential negative sentiment regarding train derailment is something I have been a little worried about because it has been a major talking point in the news cycle even though these events are far more common than the average American believed them to be.
CSX has established an 18-year history of dividend increases which it has consistently seen increases in the upper single-digit range with the most recent increase coming in at 10%. Looking at CSX’s short and long-term history of dividend growth (3-10 years) demonstrates the kind of consistency that a dividend investor can truly appreciate. The primary downside of owning CSX shares is that it does come with a rather low dividend yield (which might be a legitimate reason why an income investor would avoid the stock) but should also indicate that the stock price is appreciating fast enough that the dividend yield can’t increase fast enough.
CSX – Transaction History 2023-4 (Charles Schwab)
The dividend was increased from $.10/share per quarter to $.11/share per quarter. This represents an increase of 10% and a new full-year payout of $.44/share compared with the previous $.40/share. This results in a current yield of 1.38% based on the current share price of $31.38.
Chevron – Energy stocks have rebounded over the last few weeks and most of those companies have stock prices that are likely near the top-end of the price range. I think one of the more interesting developments for CVX was the announcement that they have developed a new gasoline blend that has 50% renewable content and offers emissions similar to that of an electric vehicle. Walmart (WMT) and Cummins (CMI) have recently announced a partnership to build a 15-liter engine and have it make its maiden voyage from Indiana to California for a test run.
While politicians and public figures continue to push for the adoption of electric vehicles they never bothered to explain the negative environmental impacts that come from open pit mining rare earth minerals in Africa. For this reason, I believe that these types of developments are opportunities that could have a significant impact on how we utilize energy moving forward. Creating more efficient fuel sources like this has the potential to be implemented on a global scale.
CVX – FastGraphs 2023-4 (FastGraphs)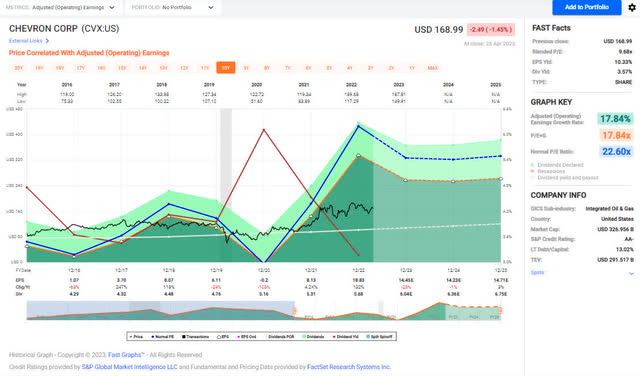
The dividend was increased from $1.42/share per quarter to $1.51/share per quarter. This represents an increase of 6.3% and a new full-year payout of $6.04/share compared with the previous $5.68/share. This results in a current yield of 3.57% based on the current share price of $171.48.
Intercontinental Exchange – ICE is a more recent addition to the portfolio and is likely best known for its involvement in facilitating the derivatives market for everything from precious metals and commodities to interest rates. I like to think of ICE as the technological side of the trade which means that in comparison to a boat transporting oil across the oceans that ICE is the channel that helped negotiate the deal that made the transaction possible.
The acquisition of Black Knight (BKI) has been challenged by the FTC claiming that “This deal would reduce competition in key areas of the mortgage process, ultimately raising costs for lenders and homebuyers.” Without getting too political I find this somewhat comical given the news that Biden recently announced mortgage changes will punish the most qualified borrowers in order to help subsidize less qualified borrowers.
The stock price has moved out of my buy range which is anything under $100/share. With a dividend yield of 1.55% ICE is a lot like CSX in the sense that income investors might not find the yield compelling enough to consider. However, when we factor in the double-digit average dividend increase it shows a company with a strong earnings growth record that is able to offer a very stable dividend.
ICE – FastGraphs 2023-4 (FastGraphs)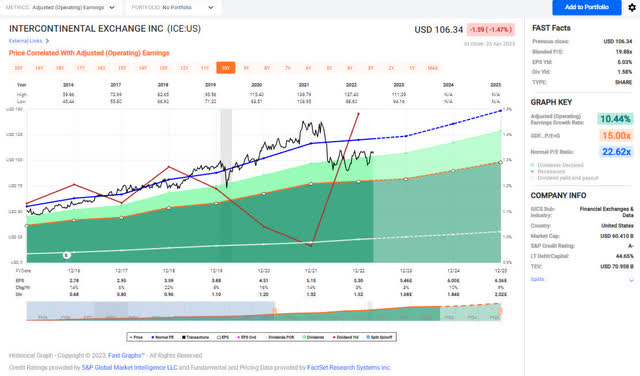
The dividend was increased from $.38/share per quarter to $.42/share per quarter. This represents an increase of 10.5% and a new full-year payout of $1.68/share compared with the previous $1.52/share. This results in a current yield of 1.55% based on the current share price of $107.93.
Main Street Capital – paid a supplemental dividend of $.175/share in the month of March.
Masco – MAS is involved in the design, manufacturing, and distribution of home improvement products, and it’s likely that you have a toilet or a faucet in your house that is one of MAS’s many brands. MAS has benefitted from the growth of the home improvement industry with many homeowners initiating renovations by utilizing the equity in their homes to perform renovations that often include many of the products in MA’s arsenal. I am more cautious about the potential price appreciation of MAS’s stock price due to slowing demand for home renovations especially as housing sales have dropped considerably with the rise of interest rates. This isn’t necessarily a terrible scenario for MAS but I think it explains why the estimated earnings in 2023 are expected to be down 12% from 2022.
We are waiting for a better entry point before adding more to this position and I think that a pullback to the low $40/share range is a better opportunity.
MAS – FastGraphs – 2023-4 (FastGraphs)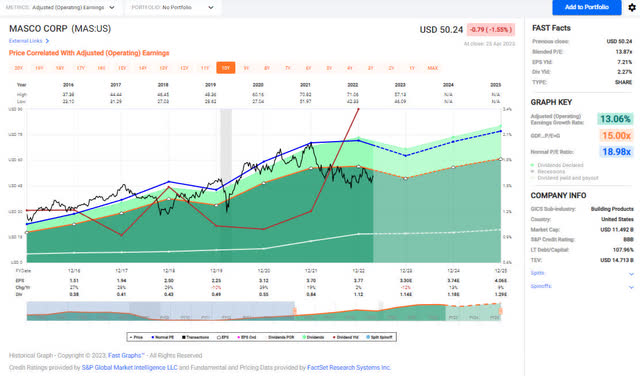
The dividend was increased from $.28/share per quarter to $.285/share per quarter. This represents an increase of 1.8% and a new full-year payout of $1.14/share compared with the previous $1.12/share. This results in a current yield of 2.24% based on the current share price of $51.03.
Realty Income – The dividend was increased from $.2485/share per month to $.2545/share per month. This represents an increase of 2.4% and a new full-year payout of $3.054/share compared with the previous $2.982/share. This results in a current yield of 4.94% based on the current share price of $62.09.
Oshkosh – OSK produces some of the most unique vehicles seen on and off the roads including fire trucks, large snow plows, and cranes. Until recently, one of the most lucrative contracts has been the production of tactical vehicles for the military which was worth $8.6 billion or roughly 12% of 2023 revenues. Other factors playing into this are weak delivery times and growing backlogs that have more to do with overall weakness in the supply chain.
On the positive, fellow SA contributor Stephen Simpson recently wrote the article Losing The JLTV Recompete Intensifies Oshkosh’s Operational Challenges where he noted that demand for other areas like cement trucks and refuse vehicles could generate the business needed in order to compensate for the loss of the JLTV projects. We won’t consider adding more unless the price drops into the low 70’s/late 60’s.
OSK – FastGraphs 2023-4 (FastGraphs)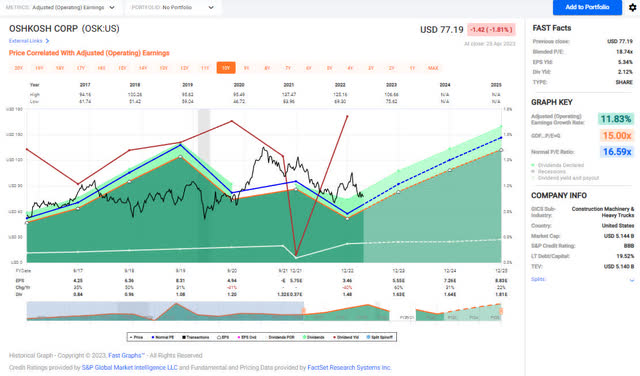
The dividend was increased from $.37/share per quarter to $.41/share per quarter. This represents an increase of 10.8% and a new full-year payout of $1.64/share compared with the previous $1.48/share. This results in a current yield of 2.09% based on the current share price of $51.03.
Prologis – PLD has been on a tear with its stock price and at one point saw its price triple over the span of four years. This industrial REIT has nine years of consecutive dividend growth and currently averages 11.21% over the last ten years. PLD’s growing dividend payouts have been supported by FFO growth at the same level. It is worth noting that he pullback in PLD’s stock price really came from concerns about Amazon (AMZN) announcing a slowdown in e-commerce and that they would sublet existing industrial space because they had too much of it. It wasn’t just AMZN that announced this as other companies have toyed with very similar ideas.
Other Fortune 500 retailers are looking at subletting traditional warehouses they committed to long-term, because they are not in close enough proximity to customers to be used for last-mile distribution and no longer meet the needs for first-mile use, explains Kris Bjorson, international director of Industrial Brokerage at JLL. He notes that these warehouses, which were originally designed for first-mile use, are now considered mid-market because cities grew around them so they are stuck in the middle between first- and last-mile use.
In other words, this isn’t necessarily a bad trend but the location of facilities have changed and that can have a real impact on what the facility is used for and the value it provides.
PLD at $110/share is very attractive and is the new low for the company. The stock price has been fairly stable since the pullback in April 2022. We are looking to add more shares if/when the price pushes these lows again. Compared to other major industrial REITs PLD stock price has performed the best over the last decade.
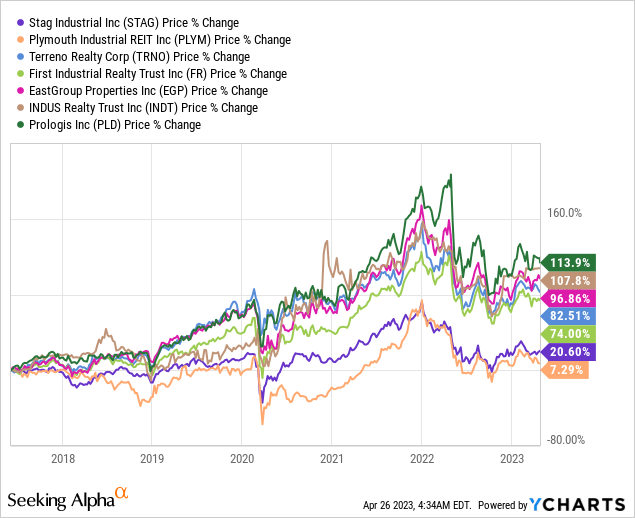
The dividend was increased from $.79/share per quarter to $.87/share per quarter. This represents an increase of 10.8% and a new full-year payout of $1.64/share compared with the previous $1.48/share. This results in a current yield of 2.09% based on the current share price of $51.03.
T. Rowe Price – The dividend was increased from $1.20/share per quarter to $1.22/share per quarter. This represents an increase of 1.7% and a new full-year payout of $4.88/share compared with the previous $4.80/share. This results in a current yield of 4.42% based on the current share price of $112.50.
Valero – The position in VLO was established by making a lot of small purchases over a long period of time. VLO’s dividend growth hasn’t been anything too exciting (it doesn’t fit the model of years of consecutive dividend increases) and I would surmise that part of the reason for this is the somewhat volatile spreads that come from the spread it makes by refining energy products into value-added products like vehicle fuel, jet fuel, etc. 2022 was the best year of performance for the stock which made more income in Q4-2022 than its entire dividend payout for the year would be.
One justifiable concern is that the dividend increase offered was too meager given the level of profitability and I would say that is justified. It is estimated that VLO will earn $23.20/share in FY-2023 but at the current dividend would only payout $4.08/year total.
We would consider adding more on weakness but it would take a very large pullback because the position is already very large and the average share price of the current position is about $60/share. I am hoping that maybe management will consider an approach of small dividend increases with rewards of special dividends when it makes sense. I don’t expect to add any shares anytime soon because strong spreads on pricing are expected to continue thus keeping VLO’s price high.
VLO – FastGraphs – 2023-4 (FastGraphs)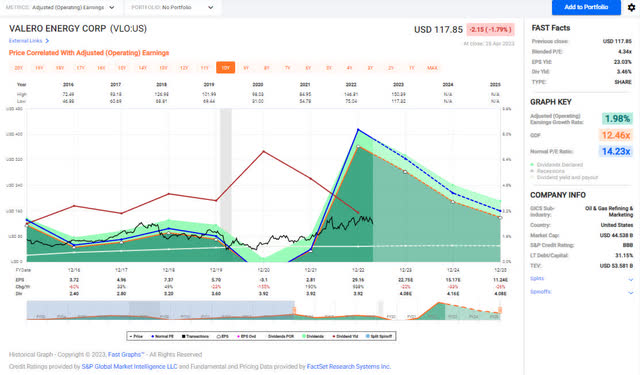
The dividend was increased from $.98/share per quarter to $1.02/share per quarter. This represents an increase of 4.1% and a new full-year payout of $4.08/share compared with the previous $3.92/share. This results in a current yield of 3.46% based on the current share price of $117.85.
Retirement Account Positions
There are currently 39 different positions in John’s Traditional IRA and 23 different positions in John’s Roth IRA. While this may seem like a lot, it is important to remember that many of these stocks cross over in both accounts and are also held in the Taxable Portfolio.
Below is a list of the trades that took place in the Traditional IRA during the month of March.
Traditional IRA -March 2023 Trades (Charles Schwab)
Below is a list of the trades that took place in the Roth IRA during the month of March.
Roth IRA – March 2023 Trades (Charles Schwab)
March Income Tracker – 2022 Vs. 2023
We are starting with a clean slate for 2023, and with all of the expected dividends (based on currently owned shares and announced dividend payments), the account is set for a large decrease in the Traditional IRA and a large increase in the dividend income generated by the Roth IRA. The reason for the large decrease in the Traditional IRA was the special dividend paid by Healthcare Trust of America (HTA) when it was acquired by Healthcare Realty (HR) – This can also be seen in the huge growth in 2022 dividends which came in at a whopping 35.3%. If this dividend is removed then the growth year-over-year is trending as flat overall. While it’s possible we could see more special dividends in 2023 I think it’s more likely that executive management will focus on deleveraging or stock buybacks in most cases.
The Traditional IRA is expected to generate an average of $1,348.39/month of dividend income in 2023 compared to the average monthly income of $1,485.63 generated in FY-2022. The Roth IRA is expected to generate an average of $805.85/month of dividend income in 2023 compared to the average monthly income of $710.57 generated in FY-2022.
Once dividend increases are factored in and the additional interest income from CDs I expect we will see a very light increase in dividend income of 3-4%. (In this assumption I am also factoring out the large special dividend from the HTA acquisition but if I leave that in then I estimate we will see an overall negative combined dividend yield growth of 1-2%.)
John plans to continue collecting $1,000/month from his Traditional IRA which matches the amount he withdrew monthly in 2022.
SNLH = Stocks No Longer Held – Dividends in this row represent the dividends collected on stocks that are no longer held in that portfolio. We still count the dividend income from stocks no longer held in the portfolio, even though it is non-recurring. All images below come from Consistent Dividend Investor, LLC. (also referred to as CDI as the source below).
The tables below represent which companies paid dividends in March 2023 and how that income source has changed since March of the previous year.
Traditional IRA – March – 2022 V 2023 Dividend Breakdown (CDI) Roth IRA – March – 2022 V 2023 Dividend Breakdown (CDI)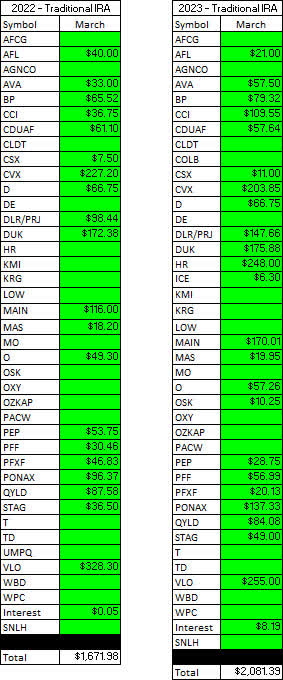
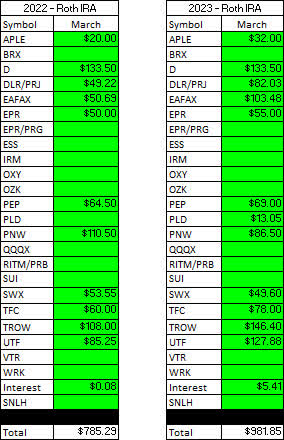
The table below represents all income generated in 2022 and collected/expected dividends in 2023.
Retirement Projections – March 2023 (CDI)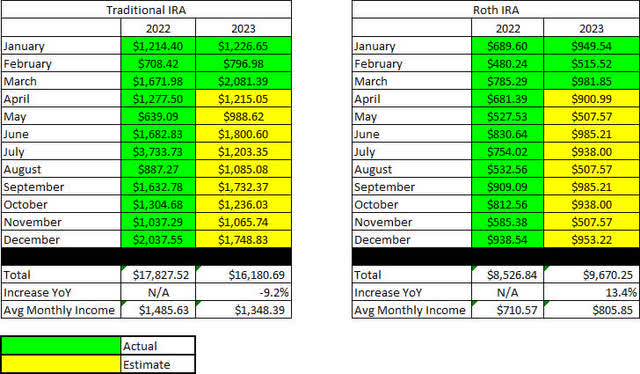
Below gives an extended look back at the dividend income generated when I first began writing these articles. I find this table to be most useful when comparing how dividend income has improved for a specific month over the course of six years.
Retirement Projections – March 2023 – Full Dividend History (CDI)
The balances below are from March 31, 2023, and all previous month’s balances are taken from the end-of-month statement provided by Charles Schwab.
Retirement Account – Month End Balances – March 2023 (CDI)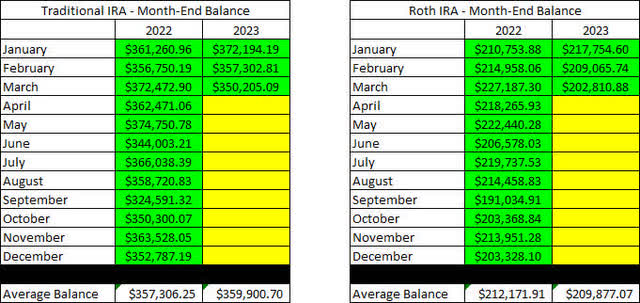
The next image is also pulled from the end-of-month statement provided by Charles Schwab which shows the cash balance of the account.
**Please note that cash balances may fluctuate based on CD renewal dates because I only count the cash that is 100% liquid. There were larger fluctuations in 2019 and 2020 that we the result of deposits and withdrawals being made. There will be no contributions made into either account in 2023 because John is no longer working.
Retirement Accounts – March 2023 – Cash Balances (CDI)
The next image provides a history of the unrealized gain/loss at the end of each month going back to the beginning of January 2018.
Retirement Accounts – March 2023 – Unrealized Gain-Loss (CDI)
I think the table above is one of the most important for readers to understand because it paints a story of volatile markets and why we employ the strategy of generating consistent cash flows to overcome the uncertainty of the market. If we were dependent on selling shares to generate income for John and Jane’s retirement they would have to be much more considerate of when they withdraw and how much they choose to withdraw.
For example, a withdrawal in 2020 where shares must be sold would destroy more value by locking in losses or poor performance by stocks being sold compared to selling the same shares and withdrawing funds in 2021.
In an effort to be transparent about John’s Account, I like to include an unrealized Gain/Loss summary. The numbers used are based on the closing prices from April 22, 2023.
Traditional IRA – March 2023 – Gain-Loss (CDI) Roth IRA – March 2023 – Gain-Loss (CDI)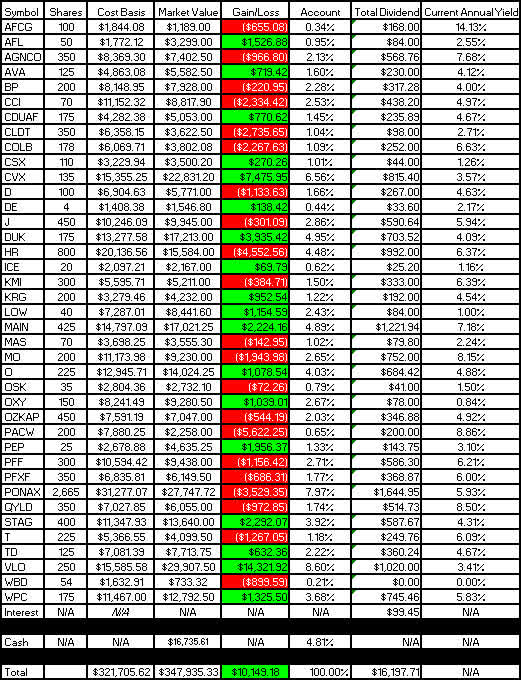
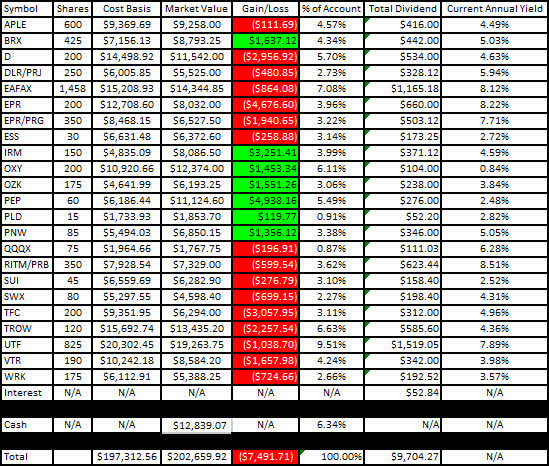
It is worth noting in the table above that the yield column is most accurate at the start of the year, but if I reduce the size of positions it may inflate the yield because it is based on how much dividend income is collected. At the same time, it may report excessively low dividends for positions added or significantly increased at the end of the year.
The last image represents the withdrawals being made from John’s Traditional IRA, as this is the only account he is currently withdrawing funds from. As mentioned before, he continues to withdraw $1,000/month.
Traditional IRA Withdrawals – March 2023 (CDI)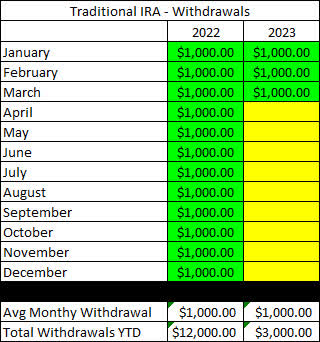
Conclusion
March is a heavy month for dividend increases which made John and Jane’s articles very dense. Most of the dividend increases were at or above expectations which was nice to see especially as we head into what is likely a recessionary environment. I am expecting that dividend growth is likely to slow along with corporate earnings with more going towards interest and other expenses that are impacted by inflation.
March Articles
I have provided the links to March Taxable and Jane’s February Retirement articles below.
The Retirees’ Dividend Portfolio: John And Jane’s March 2023 Taxable Account Update
The Retiree’s Dividend Portfolio, Jane’s March Update: 12 Stocks Generating More Dividends
In John’s Traditional and Roth IRAs, he is currently long the following mentioned in this article: AFC Gamma (AFCG), Aflac (AFL), Apple Hospitality REIT (APLE), Avista (AVA), BP plc (BP), Brixmor Property Group (BRX), Crown Castle (CCI), Canadian Utilities (OTCPK:CDUAF), Chatham Lodging Trust (CLDT), Columbia Banking System (COLB), Chevron (CVX), CSX (CSX), Dominion Energy (D), Deere (DE), Digital Realty Preferred Series J (DLR.PJ), Duke Energy (DUK), Eaton Vance Floating-Rate Advantage Fund (EAFAX), EPR Properties (EPR), EPR Properties Preferred Series G (EPR.PG), Healthcare Realty (HR), Intercontinental Exchange (ICE), Iron Mountain (IRM), Kinder Morgan (KMI), Kite Realty Group (KRG), Lowe’s (LOW), Main Street Capital (MAIN), Masco (MAS), Altria (MO), New Residential Investment Corp. Preferred Series B (NRZ.PB), Realty Income (O), Oshkosh (OSK), Occidental Petroleum Corp. (OXY), Bank OZK (OZK), Bank OZK Preferred Series A (OZKAP), PacWest Bancorp (PACW), PepsiCo (PEP), iShares Preferred and Income Securities ETF (PFF), VanEck Vectors Preferred Securities ex Financials ETF (PFXF), Pinnacle West (PNW), PIMCO Income Fund Class A (PONAX), Nuveen Nasdaq 100 Dynamic Overwrite Fund (QQQX), Global X Funds Nasdaq 100 Covered Call ETF (QYLD), STAG Industrial (STAG), Sun Communities (SUI), Southwest Gas (SWX), AT&T (T), Toronto-Dominion Bank (TD), Truist Financial (TFC), T. Rowe Price (TROW), Cohen & Steers Infrastructure Fund (UTF), Valero (VLO), Ventas (VTR), WestRock (WRK), Warner Bros. Discovery (WBD), and W. P. Carey (WPC).
Editor’s Note: This article discusses one or more securities that do not trade on a major U.S. exchange. Please be aware of the risks associated with these stocks.
Read the full article here


