Introduction
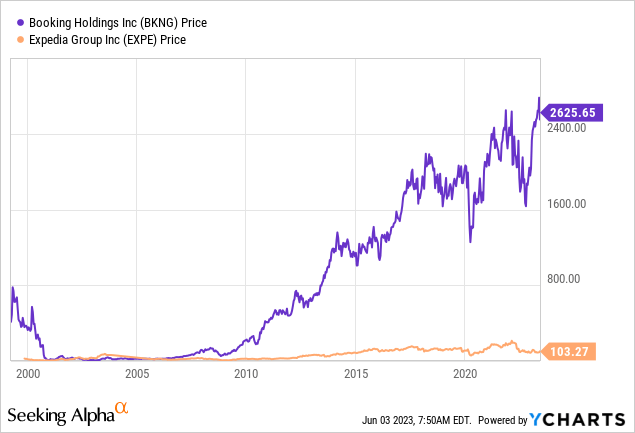
I was initially attracted to Expedia (NASDAQ:EXPE) when screening for stocks trading at low EV/EBITDA multiples. On initial examination, it also appears to be trading at a massive discount to Booking Holdings (NASDAQ:BKNG) with the former trading at a TTM P/FCF of 5.7 and the latter at 14. When taking a closer look at the two companies though, Bookings appears to be the better investment despite trading near all time highs. Zooming out on stock performance demonstrates that Bookings has a long history of compounding value whereas Expedia has struggled to keep up. I wanted to take a closer look at the two companies to better understand why there is such a stark difference.
Monitoring of Deferred Merchant Bookings
In a business like travel bookings, a major benefit is the cash that gets to be collected and held onto between the time the customer makes a purchase, and actually goes on a trip. This is recorded as “Deferred Merchant Bookings,” and is a current liability on the balance sheet with any increases getting added back to operating cash flow. This is great in periods of economic expansions but results in severe cash flow reductions in periods of economic contraction. An additional risk is the refundable nature of this cash to customers, if trips are cancelled. As we can see below, Expedia’s cash flow swung to a negative $4 billion in the 2020-2021 period while Bookings approached zero. Both experienced a rapid recovery with pent up demand moving into 2022.
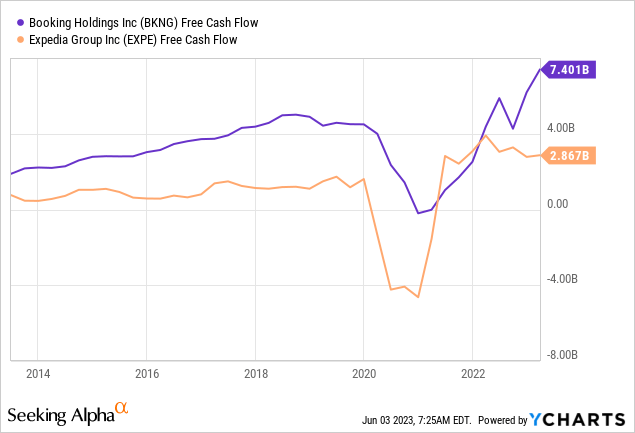
This appears to be a greater risk for Expedia moving forward as the company has been accruing a larger deferred merchant booking liability on its balance sheet. In the MRQ, Expedia reported $11 billion in deferred merchant bookings whereas Bookings reported $4.5 billion. Any travel weakness will likely once again swing Expedia’s free cash flow severely negative, and have a less pronounced effect on Bookings. So far though, travel spending appears to be resilient despite macroeconomic uncertainty.
The Issue With Stock Based Compensation
Despite Bookings having a much larger market cap and higher cash flow generation, stock based compensation for the two companies have been similar over the years. This is alarming for holders of Expedia and can be visualized below:
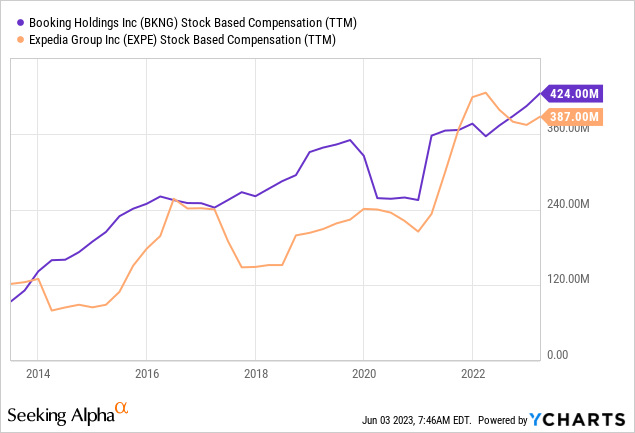
At time of writing, $387 million for Expedia represents 2.5% of market capitalization, whereas $424 million for Bookings represents about 0.4% of market cap. This is especially important, because the companies do not pay a dividend and therefore the only source of shareholder yield are buybacks. We can visualize the amount of buybacks the companies have been completing as a percentage of total market capitalization in the TTM in the chart below:
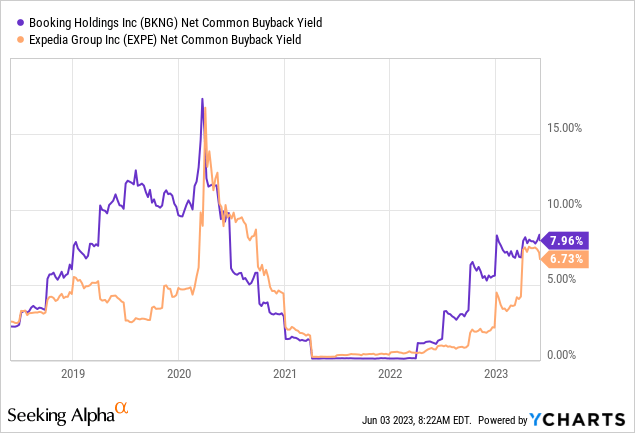
Interestingly here as well, despite Bookings appearing more expensive on a price to cash flow basis, shareholder yield via buybacks have been similar for the two companies. This difference becomes even more pronounced when we take into account the stock based compensation percentages for the TTM we calculated before. These are rough estimates, but the 6.73% buyback yield on Expedia gets reduced to 4.23% when accounting for stock based compensation, whereas Bookings’ buyback yield gets reduced to a more manageable 7.5%.
Balance Sheet Differences
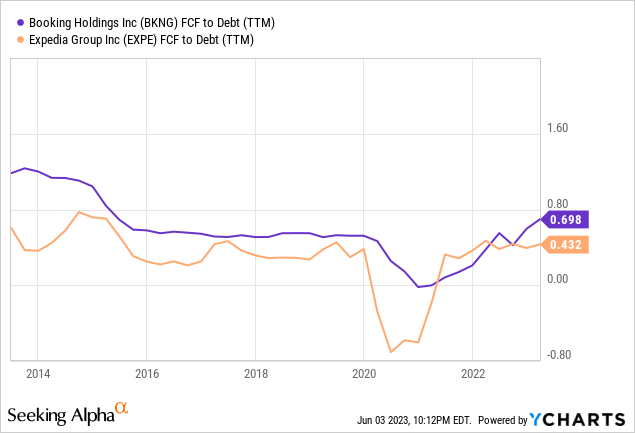
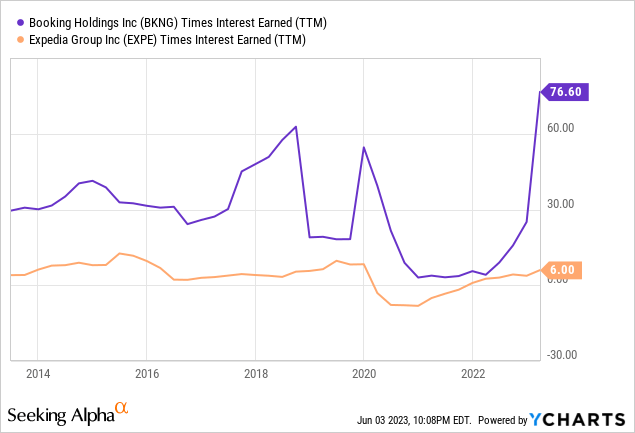
Both companies appear to have manageable termed out debt and undrawn revolvers, but again Bookings appears to be the winner here when comparing the two. Bookings has generally had much better interest coverage as well as a higher free cash flow to total debt ratio. This can be visualized below, indicating to me that Bookings is more conservatively financed:
Differences in Growth
Though many investors aren’t fans of looking at GAAP earnings, I think EPS is useful for these travel companies, as it removes the massive changes in working capital and accounts for stock based compensation. EPS also allows for the reduction in shares outstanding to shine through. Another stark contrast can be visualized below:
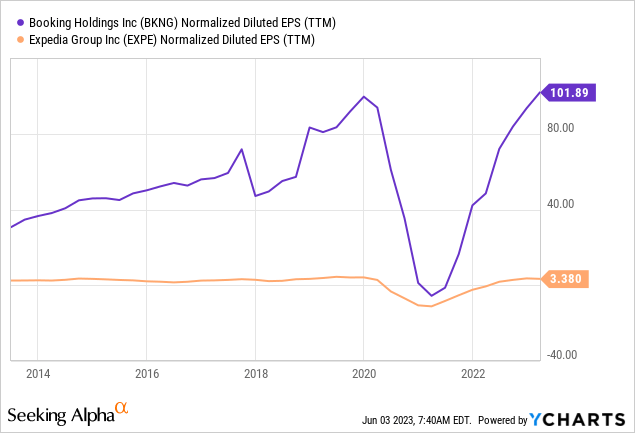
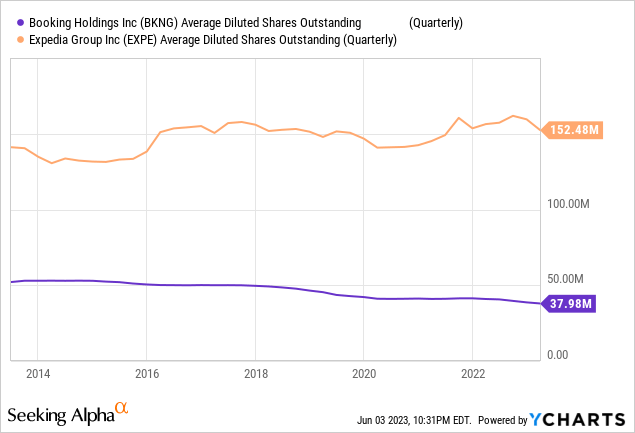
Additionally, despite Expedia appearing to participate heavily in share repurchases over the years, shareholders don’t have much to show for it. Total shares outstanding have actually increased over the most recent 10 year period, whereas Bookings has been able to reward shareholders via steadily decreasing shares outstanding.
Comparing Moats
The companies have similar business models, with both acting as online travel agents and aggregating booking information primarily with places to stay but also with rental cars, flights and other travel amenities. This provides somewhat of a moat as these companies are large and provide marketing for many global travel options. The larger the scale the better, as this provides a network effect and a good reason for hotels to keep listing on the websites, and consumers to use the websites.
Often times, I see people site Vrbo as a reason to own Expedia considering its similarity to the high flying Airbnb (ABNB). Per the Vrbo website, there are 2 million global homes listed on the website. What is ignored here, is the fact that Booking.com also has homes and other alternative stays listed on its website. Per their about page:
Booking.com is available in 43 languages and offers more than 28 million reported accommodation listings, including over 6.6 million homes, apartments, and other unique places to stay.
For reference, Expedia reports 3 million + total properties listed on its website. Clearly Booking’s scale provides a wider moat with the much larger network effect, and when consumers search the website they get the added benefit of looking at a complete list of rental homes as well as more traditional hotel stays.
Valuation
I recently covered Expedia and believe I potentially was being too optimistic with my valuation assumptions, given the company’s high stock based compensation and history of swinging cash flow negative when the business contracts. BKNG, on the other hand, has demonstrated ability to remain cash flow positive in both the 2008 financial crisis and the covid 19 pandemic.
Given there appears to be a recession on the horizon, I impaired 2024 free cash flow generation. As the company has historically recovered quickly from troughs, I assumed a 10% growth rate from assumed 2023 numbers from 2025-2027. For terminal value, I assumed a 4% growth rate as it appears to be best in class in the sector, and it has strong network effects with its large scale. I used a 10% discount rate as the company is minimally financed with debt compared to equity, and this is likely the minimum results shareholders would expect. These assumptions are demonstrated below, indicating shares are trading near fair value.
This Writer’s Estimates
Conclusion
After comparing and contrasting the two companies, I actually decided to sell my shares of Expedia as Booking Holdings appeared better on every metric despite trading near all time highs. As the price for BKNG has been volatile, there is macroeconomic uncertainty looming ahead, and the company is trading at a slight premium to our estimates of fair value, I did not purchase any shares in the company. Another buying opportunity could present itself, as accounting for deferred merchant bookings makes cash flow fall precipitously during periods of economic contraction. I do believe that this is a great shareholder friendly business trading near fair value, so long term investors should do fine at current valuations parking their money here for years to come.
BKNG’s more conservative financing as well as more shareholder friendly buyback and stock based compensation policies likely demonstrate why it has been such a high performing compounder when compared to its closest peer, EXPE. BKNG also appears to have a greater moat when comparing network effects, as it has many more properties listed on its website. Below is the difference in price performance over time, which is perhaps the most striking comparison chart of them all.
Read the full article here


