Sure, the title to this article appears to be a bit over-ambitious. Almost no one can always buy at the bottom and sell at the top. Not even the legends like Warren Buffett. But we do not need to buy at the bottom and sell at the top. There is a difference between “buying low and selling high” and “buying at the bottom and selling at the top.” The strategy we discuss is about buying or selling small quantities of shares (of a stock) when certain thresholds are met. This idea is not new and could be attributed to several famous people and past authors.
So, what is the idea? This is a systematic and methodical approach to investing in solid blue-chip dividend-paying stocks. The approach appears to provide lower volatility and higher long-term performance over the S&P 500 Index (SP500). In our back-testing model covering nearly 28 years, the model provided an alpha of nearly 5% annually over the S&P500. This extra 5% annual outperformance can result in a huge difference over 28 years. That said, there are certain shortcomings. This method is not for folks who want or need to invest a large sum of capital in one lump sum. This is mostly beneficial to folks who would have a regular income stream and the ability to invest regularly over a long period of time.
So, in brief, here are some caveats:
- This is not a get-rich-quick scheme. It is not easy to follow a strategy consistently with discipline for a decade or more. It is often easier said than done.
- The strategy needs some knowledge of the market. It does not eliminate the need to pick the right kind of companies. However, if you pick a few bad apples along the way, it won’t hurt the long-term results too much.
- The strategy does not work very well for lump sum investments. It requires capital inflows over several years.
Note: We have written about this topic a few times in the past on SA, and every once in a while, we come back to re-evaluate the strategy by means of back-testing. This provides us and our regular readers to validate the process and its success. At the same time, it gives new readers fresh ideas and something to explore.
Is This Strategy A Right Fit For You?
Not every strategy is right for everyone. You are the best judge to see if a particular strategy would fit your needs and temperament. This strategy requires discipline, patience, and time to be able to grow wealth over time. It is not for short-term traders. It also requires that you invest gradually over time and need fresh capital every now and then for many years. That means you can’t invest in just one lump sum. It is ideally suited for folks who are in the accumulation phase and are willing to save and invest on a regular basis for a couple of decades.
Buy-Low Sell-High Strategy [“BLSH”] Using DGI Stocks
Assumptions:
The strategy requires that you invest overtime in small lots and not in one big lump sum. It suits the working folks perfectly because they earn a regular wage and generally invest (or can invest) a fixed sum of money at regular intervals. However, if you are retired, it may seem that the strategy would not work as all your money is already invested. But that’s not wholly true. Retirees could also transition their portfolios to work on this strategy. They could earmark some of their holdings for this strategy and sell overvalued securities to raise some cash to be able to buy later. Since the strategy itself tells you when something is overvalued and when something is undervalued, there is no guesswork needed.
In summary:
- It is best suited for folks who are in the accumulation phase.
- For folks who are in the withdrawal phase (retirees, for that matter), it will be less appealing. That said, they can still adopt it, at least on a limited basis.
- The strategy does not allow a lumpsum investment.
There are two parts to the strategy, the buy strategy and the sell strategy.
Buy Strategy:
The first task is to select at least 10 (or more) stocks. We need to select the stocks with the following criteria in mind.
- They should be fairly large and stable companies with a market capitalization of over $10 billion.
- All our companies would be dividend-paying companies. We should require that they at least have a 10-year dividend growth history.
- We should also select half of the companies that have a history of doing relatively well during large corrections and recessions.
Target Buy Price:
For each stock in our portfolio, we will calculate the average of the past 252 trading days, which is generally equal to one year of trading data. Subsequent to this, we will multiply this average price by a ‘Buy-Low Factor’ to derive the target-buy-price. This factor is explained in the next para. We can do this on a daily basis or weekly basis. For the purpose of the back-testing presented in this article, we have used daily data (end-of-day data). Once the current price of a stock is below the “target-buy-price,” that will signal to add/buy some shares. How many shares we buy will depend upon the total shares we can have for this stock and our current holding.
Buy-Low Factor:
This is something that will be used to determine the buy price for our next lot for a particular stock. The buy-low factor can generally vary between 0.85 to 0.90 depending upon the volatility of the stock.
The value of this factor will vary between 0.85 to 0.90 since we will only be using dividend stocks. If, for any reason, you decide to use high-growth tech stocks, the value of this factor should be lower, like 0.80 (or less). For any given stock, we should look at the annual volatility. For low-volatility stocks, the Buy-Low Factor would be 0.90. For stocks with medium volatility, it should be 0.85.
You can obviously check the volatility of any stock (over a given period) and compare it with the S&P500. However, to keep things simple, you could also categorize stocks based on their past history and the industry they operate in and determine how volatile they are.
Some examples of low or high-volatility stocks:
- The Coca-Cola Company (KO), PepsiCo, Inc. (PEP), or The Procter & Gamble Company (PG) can be considered as a low volatility stocks.
- The Home Depot, Inc. (HD) or Lowe’s Companies, Inc. (LOW) would be considered medium volatility stocks.
- Stocks like Microsoft Corporation (MSFT), Apple Inc. (AAPL), or Amgen Inc. (AMGN) could be considered slightly higher than medium.
- Some examples of high-volatility stocks can be found in the tech sector. Many of them do not pay dividends, so they would not qualify for the test. Companies like Amazon.com, Inc. (AMZN) would be one example.
Nonetheless, for the purpose of this back-testing and simplicity’s sake, we will use the buy-low factor as 0.90 for all our stocks (that we use in back-testing)
Example:
Stock: Procter & Gamble
Volatility: Low
Buy-low-factor: 0.90
Initial shares to buy: 50 (the split-adjusted number could be a higher multiple)
Incremental shares to buy: 50
Maximum holding for any stock:
In our back-testing, we will put a maximum limit of 250 to 300 shares. However, please note that this does not include shares acquired from the reinvested dividends. Also, this does not include share increases due to splits.
Sell Strategy:
Sell Strategy is, in fact, optional. If you are a buy-and-hold kind of investor, you may not sell at all. However, that would mean that you would need to constantly add new money to the portfolio to be able to take advantage of buying opportunities (when the price of an existing holding is low).
That said, many (if not most) investors would like to sell at least partially when a stock is overvalued and may buy it back when the price becomes attractive.
Target Sell Price:
Similar to the buying strategy, for each stock in our holdings, we will calculate the average price of the past 252 trading days. However, unlike the buy-strategy, the sell-strategy will use multiple criteria before a sell decision is taken. This is done to ensure that we do not end up selling too soon.
- Current shares held match or exceed the threshold allocation (the threshold set for max number of shares for any one stock). We can also set a dollar amount as a threshold.
- The current price is at least > 1.15 times 252-days-average-price.
- The current price is at least > 1.10 times the most recent buy-price (last-buy-price) for the stock.
- The current price is at least > 1.50 times our average cost basis in the stock.
As you can see, the sell criteria are much more rigid compared to the buy strategy. The strategy will notify to sell only when all four conditions are met. We will generally sell a partial quantity. The number of shares that we will sell will usually be the same number of shares that we bought in the last buy transaction. The sell strategy ensures two things: first, it will prevent us from getting overweight on any one stock. Secondly, it will ensure that we keep generating cash in the portfolio, which will enable buying the same or a different stock at a lower price or valuation in the future.
Example:
Stock: PG
Volatility: Low
Target allocation: This can be defined based on your capital availability. But, in our sample portfolio, we will allocate a maximum of 250-300 shares to any single stock. So, we will sell when the holding has exceeded 300 shares, or the invested sum has exceeded a certain threshold, excluding the reinvested dividends.
Sell-high-factor: There is not a single criterion but a combination of multiple criteria.
No. of shares to sell in one lot: 50.
Stock Selection for Back-Testing:
In this strategy, stock selection is important and should not be taken lightly. However, we will keep selections limited to large-cap, solid blue-chip companies that also pay growing dividends. We also demand that these companies have paid and grown their dividends for a minimum of 5 years, but we would rather prefer a 10-year record.
Now, for back-testing purposes, we need to ensure that we remove the selection bias as much as possible. Obviously, it is almost impossible to remove bias completely, but we will consciously select some companies in the mix that have not performed well in the past, even though they would meet our selection criteria.
First, we will select some companies that not only meet our basic criteria but are also known to do okay during downturns and recessions. We will, of course, be careful to select companies from many different sectors and industry segments.
Some such companies are:
Automatic Data Processing, Inc. (ADP), Amgen, The Clorox Company (CLX), Fastenal Company (FAST), Johnson & Johnson (JNJ), McDonald’s Corporation (MCD), NextEra Energy, Inc. (NEE), Procter & Gamble, Verizon Communications Inc. (VZ), and Walmart Inc. (WMT).
As we stated before, to remove or negate the impact of selection bias, we will now intentionally select some companies that would have met most of our dividend criteria but still have not fared well in the last couple of decades. Three such stocks are Bank of America Corporation (BAC), Altria Group, Inc. (MO), and Verizon. As such, all three companies have paid dividends for a long time, but their performances have been quite unattractive.
BAC performed very badly in 2008-2009 due to the subprime mortgage crisis. BAC also reduced its dividend from 32 cents to just 1 cent a quarter during that time. The company eventually survived and recovered, but its share price still trades below its pre-recession levels.
The second company that has performed badly during the last several years is Altria, though it was a top performer earlier. VZ is an example of a moderate performer, but last couple of years, it has underperformed the broader market in a very significant way due to concerns about its large debt load. Besides, we have also included some other moderate performers like Walmart.
Our back-testing model selects 15 companies and keeps the same stocks for the entire period of roughly 28 years. However, in real life, we could add or remove some stocks when conditions and ground realities change, though it should not be frequent.
Table-1: The final list of 15 stocks:
Author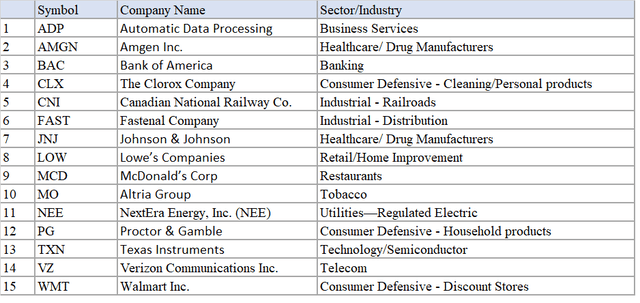
Back-testing: Buy Low and Sell High Strategy
For back-testing purposes, we will make the following assumptions:
- The back-testing period will be from Jan. 1995 until May 26, 2023, roughly a period of 28 years.
- For any one stock, we will buy a maximum of 250-300 shares; however, only 50 shares at a time.
- We will initiate the sell strategy only when the holding (for any stock) is 250 to 300 shares. No sale will occur when the shares count falls to 200 or below unless the actual invested capital in the stock has exceeded $25,000.
- The back-testing will cover a period from January 1995 until May 26, 2023.
Buy rules:
- We buy the first 50 shares of each of the 15 stocks on the first day of the testing period. That is our first and only investment without any system-generated buy signal. Please note that the number of shares is assumed to be on a pre-split basis. For example, let’s say we bought 50 shares in Jan. 1995, which was followed by two 2:1 splits, first in 1997 and second in 2004. In this case, post-split (s), our original 50 shares would become 200 (50*2*2) shares.
- Buy any subsequent shares when the current price is less than the Buy-Low factor (0.90 for stocks in our selection) of the average price of the past year (roughly equivalent to 252 trading days).
- Also, after our first buy for a stock, any subsequent purchase will be at least 252 trading days apart.
Sell rules:
- Check the shares count threshold (as well as the dollar amount). No sell signal is generated unless the total shares in a company have reached 250 or the invested capital in the stock has exceeded $25,000, excluding the reinvested dividends.
- Sell if the current price is > 1.15 times the average price of the past year (that is 252 trading days) and > 1.10 times the price of the last (most recent) purchase, and > 1.50 times the average purchase price of the stock in our portfolio.
- Any two subsequent sales will be at least 252 trading days apart.
In our back-testing, we used the daily EOD (end-of-day) data, and the system ran the check to generate buy or sell signals based on our rules.
Below, we present tables (covering each of the 15 stocks) covering buy-sell transactions, which were determined by our system during the period from 01/01/1995 until 05/26/2023.
Prices shown (in the tables) are split-adjusted prices.
Note: Column “Split-Ratio” – If there were two splits of 2:1 after the purchase date, the shares prior to two splits will be considered to have a split ratio of 4:1 (2*2:1), and so on. The total shares shown are on a pre-split basis.
Table-2-a: ADP
Author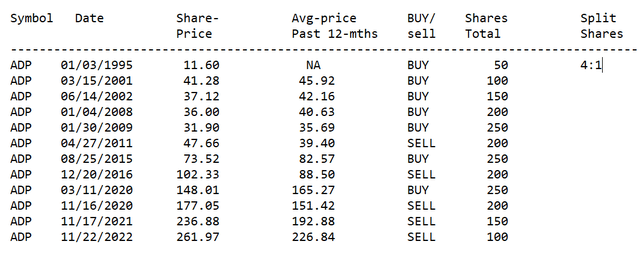
Table-2-b: AMGN
Author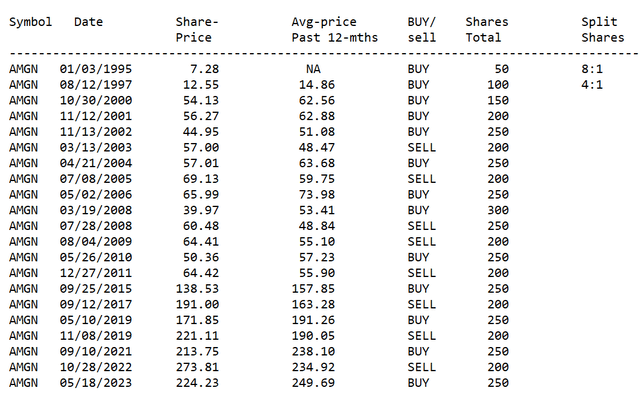
Table-2-c: BAC
Author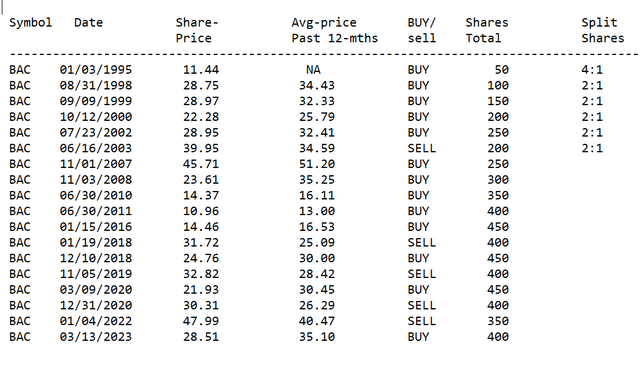
Table-2-d: CLX
Author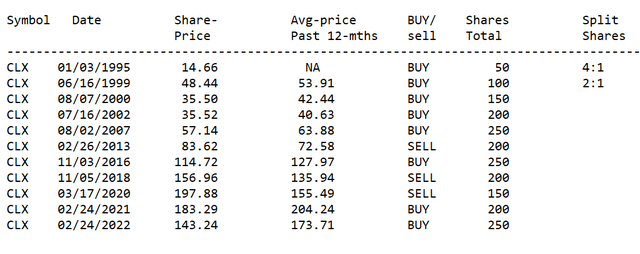
Table-2-e: CNI
Author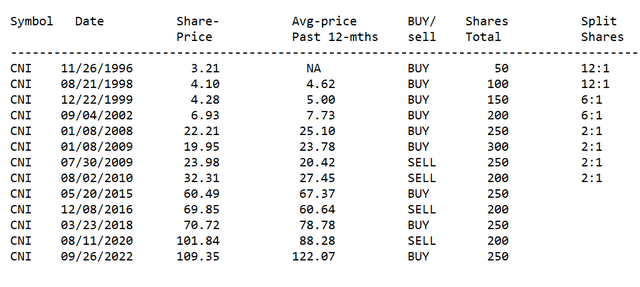
Table-2-f: FAST
Author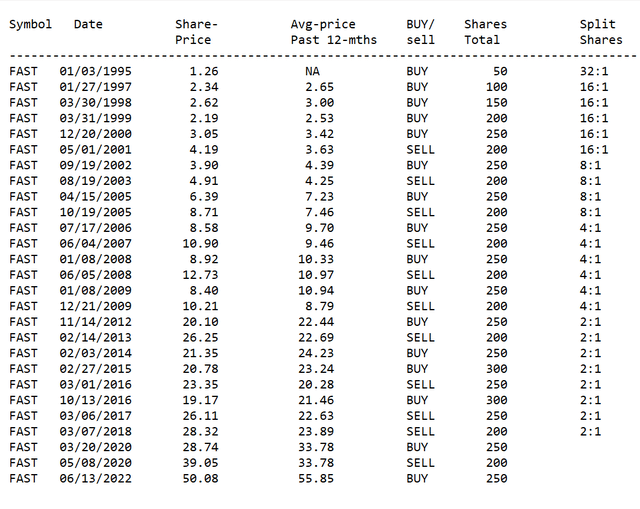
Table-2-g: JNJ
Author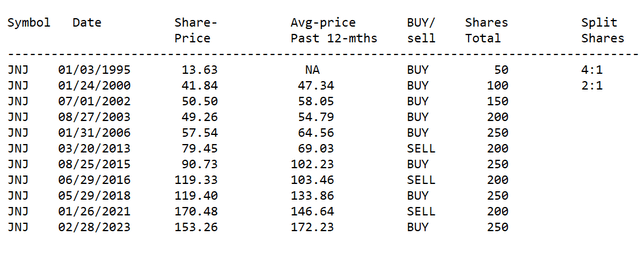
Table-2-h: LOW
Author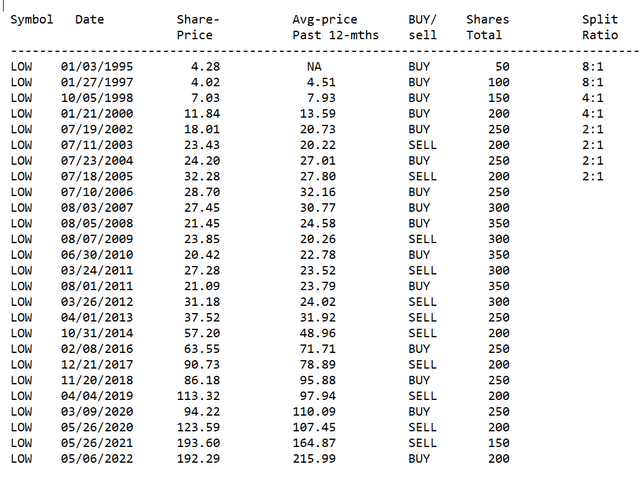
Table-2-i: MCD
Author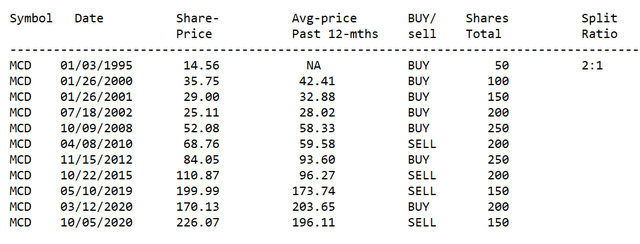
Table-2-j: MO
Author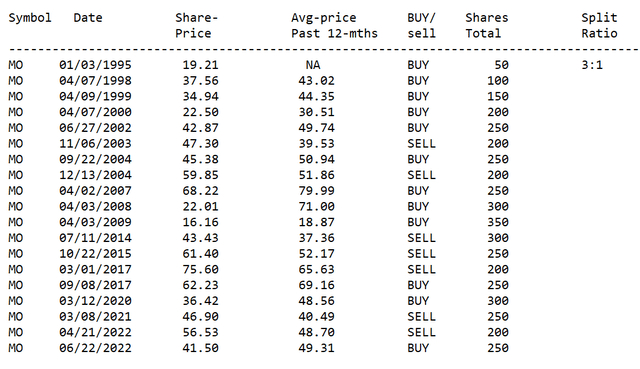
Table-2-k: NEE
Author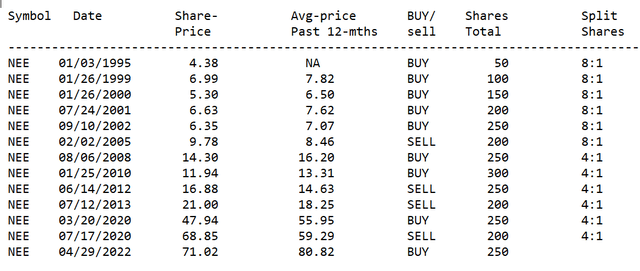
Table-2-l: PG
Author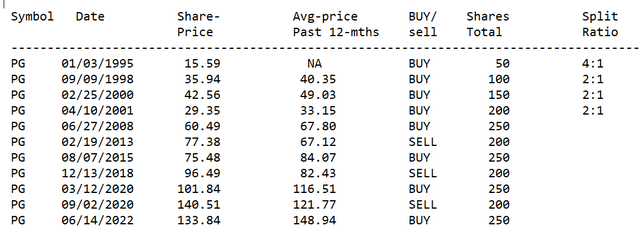
Table-2-m: TXN
Author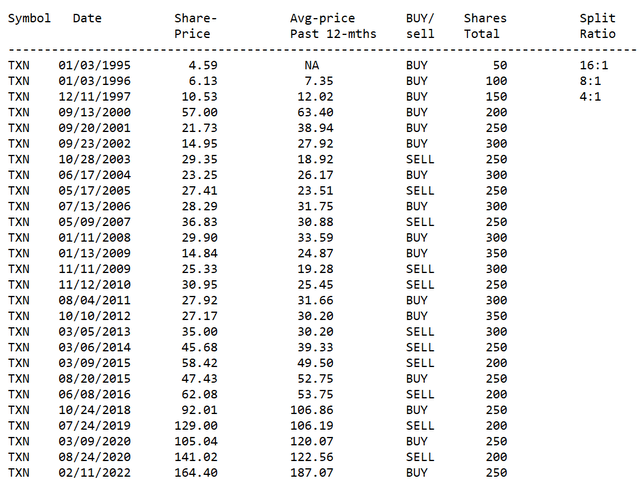
Table-2-n: VZ
Author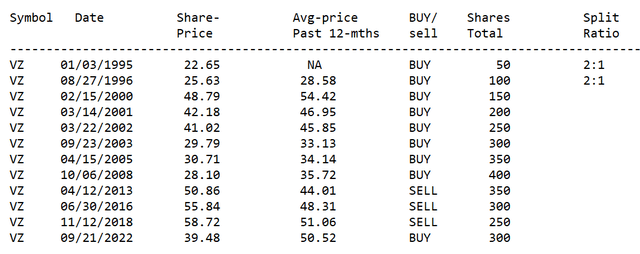
Table-2-o: WMT
Author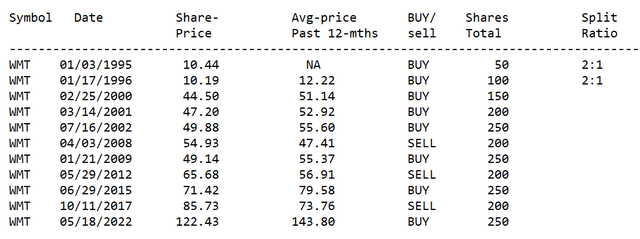
Performance:
We present below the performance comparison of the model BLSH portfolio (Buy Low Sell High) with the S&P500.
Table – 3
Author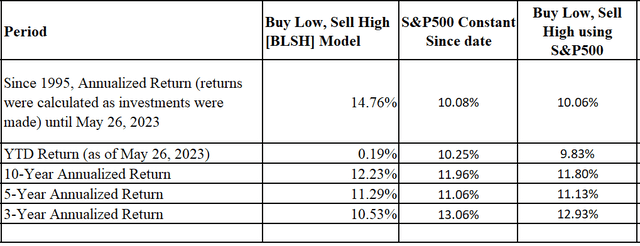
As you can see in the above table, the last two columns for S&P500 are not much different, if not identical. Column 2 is calculated as if a fixed sum was invested at the beginning of the period (as of Jan. 1995 or 10 years prior). Column 3 is calculated using the BLSH model strategy with SPY as the only asset. That tells that the BLSH strategy does not provide much alpha if the instrument is an ETF like SPY with a large number of holdings. Below is the table of transactions for SPY. There were only 12 transactions (including the first five buys) in over 28 years.
Table 3B:
Author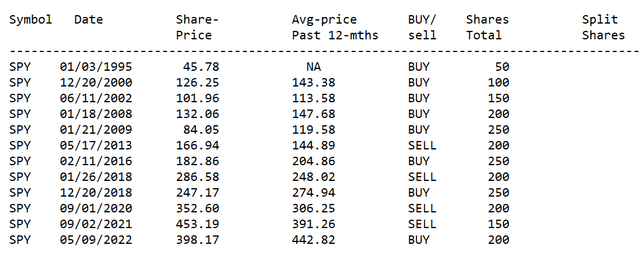
Amounts invested over the years in the 15-stock portfolio:
Table-3C:
Author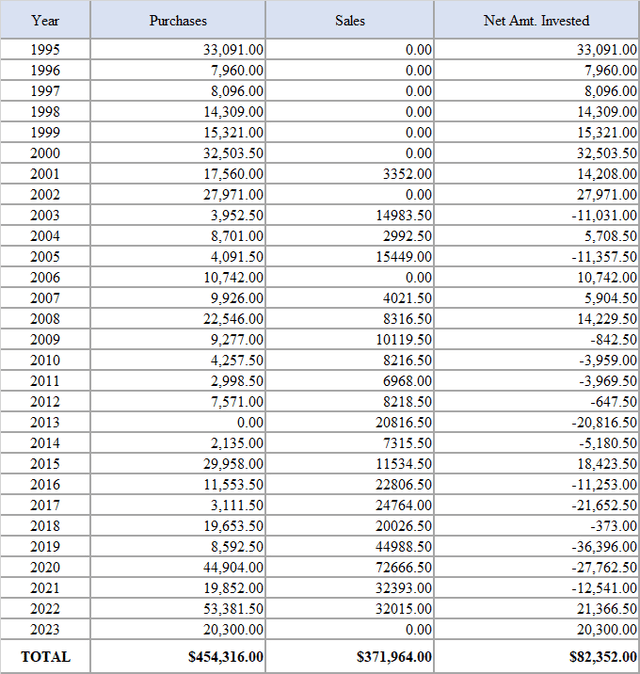
In this model, with the automated (system-guided) strategy, we have invested $454,316 over the years but have sold stocks worth $371,964 as well. This works out to a net investment capital of $82,352 invested over the years. However, it should be noted that the first few years would see larger capital inflows (investments) due to the fact that the strategy does not sell until a threshold is reached. After the first 7-8 years, the capital inflow requirements subside greatly due to the fact that we almost sell as much as we buy. The model portfolio grew into a large sum of nearly $3.1 million over 28 years, providing a CAGR of roughly 14.75%, compared to 10% of the S&P 500. This is in spite of the market correction that is still ongoing into 2023. Even though the S&P500 has gained nearly 10% in 2023, most of its gains are concentrated in the seven largest stocks.
Below is the portfolio with its current value and adjusted cost basis. As you can see, some stocks have given outsized returns, while others have provided mediocre returns. Also, there are some that performed well below expectations.
Table-3D: Portfolio Value
Author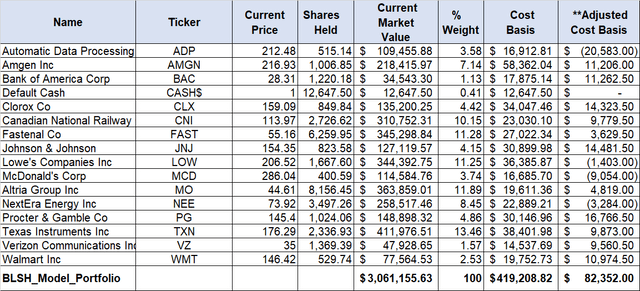
*Cost-basis = This cost basis is calculated by taking into account the actual money spent to buy the shares. This does not include calculations for reinvested dividends or distributions.
**Adjusted Cost basis = This is the same as the cost basis (above), except that any profit/loss by selling a partial lot of shares is subtracted/added from/to the cost basis.
Concluding Thoughts
As we stated earlier, we are not promising any crystal ball here. However, what we are providing is a systematic and methodical approach that eliminates the emotions from your trading. This results in superior returns over a long period of time. The second biggest advantage (also a minus for some) is that the portfolio does not require the entire investment upfront; rather, it allows us to invest gradually over many years. Obviously, you can tailor the system according to your needs and preferences, so in that sense, it offers a lot of flexibility. Our back-testing model demonstrated that even if we were to choose a few bad apples (stocks that performed subpar or poorly), overall results would still have been outstanding. However, we have only tested the strategy using large-cap, blue-chip dividend-paying, and dividend-growing stocks that are known to do well during recessionary periods. We have not done much work with high-growth or high-volatility stocks.
We will like to emphasize that more work and research may be needed to gain confidence in the strategy. The idea here is to provide a basic framework to our readers. We recommend they do further research and due diligence to formulate a coherent investment strategy.
Read the full article here


