In a recent article I discussed strategies for investing during a choppy market. The prospect of sideways trading and increased volatility is becoming more realistic as some economic indicators deteriorate while others remain resilient. This dynamic has the consequence of sending mixed signals to the market, resulting in strongly differing opinions on the future direction of markets. As I suggested in that article, I think it makes sense to shift a portion of total returns from potential capital appreciation to current income.
This can be done in numerous ways including focusing on high dividend payers and growers (with a focus on quality), increasing allocations within areas of fixed income, or seeking out alternative strategies to increase income.
A fund that uses alternative strategies to generate income is the JPMorgan Nasdaq Equity Premium Income ETF (NASDAQ:JEPQ). The fund is positioned to generate both growth and income, but with the focus mainly on income. It invests in U.S. mega cap growth/tech stocks and generates income through collecting option premiums and dividends while holding the largest names in the Nasdaq 100 Index. The fund also uses equity-linked notes to obtain broad equity exposure, limit downside risk, and reduce overall portfolio volatility. The strategy’s focus on current income makes it a defensive approach to owning some of the best companies within the mega cap growth space.
As mentioned in my previous article, I typically do not suggest covered call strategies given that they can cap upside appreciation. However, given the potential for a sideways moving market and increased volatility, I think an allocation to such a strategy might make sense for some investors. Given the crosscurrents in the economy and financial markets, I consider this fund to be a ‘Hold’ at this time.
Recent Performance
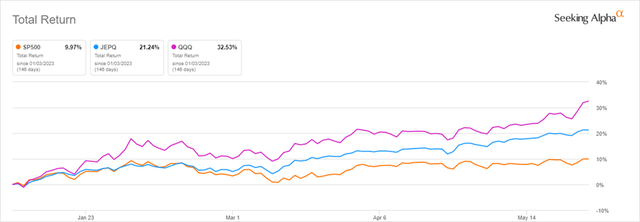
Recent performance for the fund has been strong, albeit materially below that of the unhedged Nasdaq 100 on a total return basis. This is to be expected given the rapid rise in the largest holdings and the nature of the strategy. With rapidly rising stock prices, there is a higher probability that positions will be called away, capping the appreciation of fund value.
Longer performance data is not available as trading in the fund began in May of 2022.
Year-to-Date Total Returns: JEPQ versus QQQ versus S&P 500 (Seeking Alpha)
Holdings
JEPQ provides equity exposure to the mega cap tech names that are fast-growing while also generating substantial current income. The trailing 12-month yield on JEPQ is nearly 12%, while the fund has an expense ratio of 0.35%. The underlying equity portfolio, which is benchmarked to the Nasdaq 100, is invested across nearly 90 positions including 80 stocks and 8 other holdings. Those other holdings include positions in Nasdaq equity index-linked notes and money market shares.
As expected, there is significant overlap between JEPQ and the Invesco QQQ ETF (QQQ) within the holdings. Where they diverge is with the inclusion of equity-linked notes for JPEQ that QQQ does not hold.
|
Equity Holding |
% of JEPQ |
% of QQQ |
|
Microsoft (MSFT) |
11.50% |
13.36% |
|
Apple (AAPL) |
9.59% |
12.09% |
|
Alphabet Class C (GOOG) |
7.12% |
4.05% (4.10% in class A) |
|
Amazon (AMZN) |
5.66% |
6.67% |
|
NVIDIA (NVDA) |
5.53% |
6.76% |
Managing Risk
It is difficult to provide many risk metrics (Sharpe Ratio, Upside/Downside capture, etc.) for the fund given its limited history, but it does appear that the fund is delivering returns with less volatility than its benchmark. Specifically, the annualized standard deviation of returns for QQQ is about 27% compared to just under 20% for JEPQ during its first year. Another way of looking at volatility is to look at the range of prices over the last year. For JEPQ, that range is $39.61-$49.97. The total spread between high and low as a percentage of the midpoint is about 23.1% for JEPQ versus 32.8% for QQQ, reinforcing the idea that JEPQ is at least less volatile than QQQ and the underlying benchmark. Additional data collected over time will be needed to confirm that JEPQ is delivering superior returns on a risk-adjusted basis.
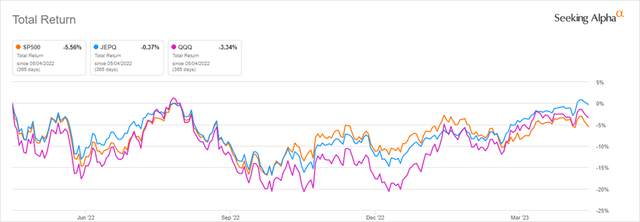
The chart below shows the first year of trading in JEPQ compared to QQQ and the S&P 500 on a total return basis. Trading during the period was choppy with a slightly negative bias. Although a short time period, it demonstrates the ability of JEPQ to deliver on its promise of reduced volatility while generating returns that are directionally similar to the Nasdaq 100 Index. Performance diverged in late May as the QQQ pulled ahead of the broader market.
1-Year Total Returns From May 4, 2022 (Seeking Alpha)
Asset Location
Given the focus on current income, and the generation of that income through dividends and the collection of option premiums, investors will want to be aware of the tax implications of owning this fund. For many investors, it might make sense to own this in their 401(k), IRA, or some other tax-advantaged account. I am not an accountant, nor do I provide tax advice, so please speak with your tax consultant about the tax consequences of owning this fund.
Final Thoughts
As one who enjoys studying the history of financial markets, there are some common observations that seemingly apply to any market environment. The power and importance of patience cannot be overstated. Making impulsive or emotional decisions rarely pays off, and as our world continues to become more fast-paced and frantic, patience will become increasingly important to individual investors. While technology and businesses evolve over time, human nature largely stays the same. Within financial markets, this means that investors repeatedly make the same types of decisions for the same reasons, namely out of fear and greed.
The investment suggested in this article, and many of my other articles, are intended for long-term investors. In this case, holding JEPQ is meant to keep individuals fully invested during what might amount to a directionless market with higher volatility. Rather than sell out of fear, I suggest lowering the average volatility of investor portfolios, capturing more returns through current income while remaining invested for the long run.
As always, these suggestions should be considered within the broader context of strategic asset allocations as well as personal needs and constraints. Any overweight or underweight positions need to be considered carefully to understand the impact on long-term total returns. Thank you for reading. I look forward to seeing your feedback and comments below.
Read the full article here


