Thesis and Background
This is an update to an article we published on the REIT sector about 1 year ago (on July 30, 2022, to be exact). In that article, we observed a concerning red flag on our market dashboard and caution readers that:
Many safe-haven sectors such as utilities, REITs, and staples are no longer “safe”. The causes are recent market turbulence and rate hikes. Recent market corrections and rate hikes impacted different sectors differently. The REIT sector now features a negative yield spread relative to its historical averages and also risk-free interest rates.
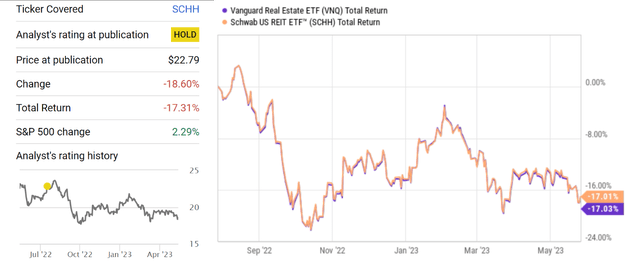
The sector indeed has suffered sizable losses since then and has lagged the broader market by a sizable margin. As seen in the chart below, the Schwab U.S. REIT ETF (NYSEARCA:SCHH) suffered a total loss of more than 17% since the publication of our original article, compared to the S&P 500’s net gain of 2.3%. Another popular REIT ETF, the Vanguard Real Estate ETF (NYSEARCA:VNQ) tracked SCHH closely and suffered the same amount of loss as seen from the right panel in the figure.
The goal of this article is to update our original article. And the thesis is to upgrade our original ratings on both funds from “HOLD” to “BUY”. And in the remainder of this article, I will detail the main factors that triggered this update/upgrade: the price corrections since then, REIT’s improved fundamentals as reflected in their dividend payouts, and the expectation of stable interest rates ahead.
Source: Seeking Alpha
SCHH and VNQ: basic information
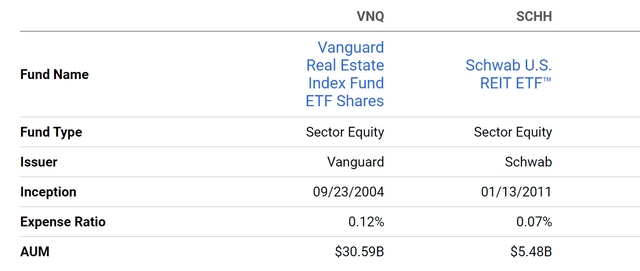
In case there are readers new to either of these ETFs, the following chart summarizes their envelop info. And their detailed indexing methods are quoted below from their web pages. VNQ has a longer history, is a larger fund ($30+ billion AUM), and offers better tradability and liquidity, although charges a higher expense ratio (0.12% compared to SCHH’0.07%). Since both funds are indexed in the U.S. REIT sector, their performance track each other closely as already shown above.
SCHH’s fund description: The fund tracks as closely as possible, before fees and expenses, the total return of the Dow Jones Equity All REIT Capped Index, an index composed of U.S. real estate investment trusts classified as equities.
VNQ’s fund description: The fund closely tracks the return of the MSCI US Investable Market Real Estate 25/50 Index. The fund’s goal is to offer high potential for investment income and some growth.
Source: Seeking Alpha
Price and Dividends changes
As aforementioned, two of the main factors that triggered this update/upgrade are the price corrections since July 2022 and their improved fundamentals as reflected in their dividend payouts. Due to these effects, their dividend yields are at a much more attractive level now. As seen from the chart below, their current yields are substantially above their historical averages. In the past 4 years, the average dividend yield (“DY”) is 2.61% for SCHH and 3.44% for VNQ. SCHH’s current DY of 3.11% is 19% above this average and VNQ’s current DY of 4.31% is 25 above this average, both signaling a large valuation discount.

Source: Seeking Alpha
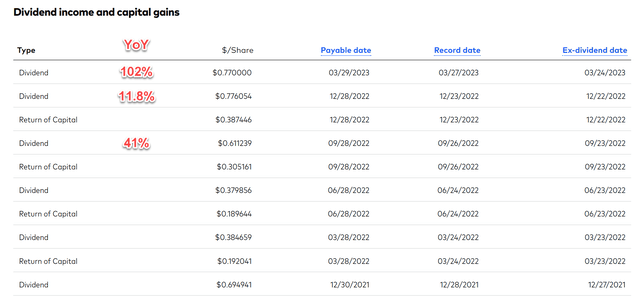
The above attractive DY was driven by both the price correction discussed early on and also more importantly, the sector’s improving fundamentals, as reflected in their dividend payouts. To wit, VNQ’s quarterly payout (excluding capital gain) since my original article has increased YOY by 41% in Sept 2022, 11.8% in Dec 2022, and a whopping 102% in Mar 2023.
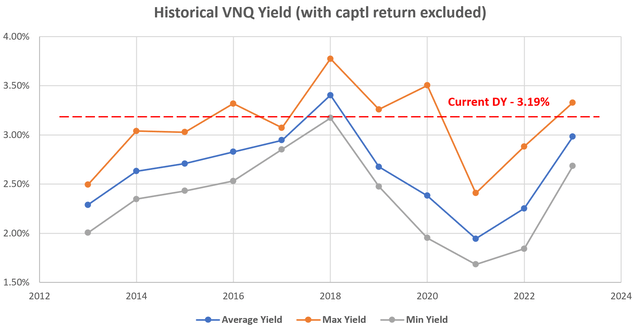
Note that here we’ve excluded its return of capital from the dividends just to isolate the fundamentals. For REIT stocks, their dividends provide a good measure of their owners’ earnings, but the capital gain from the fund does not. For example, VNQ’s TTM dividend excluding capital gain is $2.53 (not $3.42 as commonly quoted on most websites such as the one shown above). A good tip for you to correctly interpret REIT’s dividend data. Once the capital gain is excluded, the current DY from the REIT sector is even more attractive. Take VNQ as an example, its current “real” DY, i.e., with capital gain excluded, is 3.19%. It is of course lower than 4.31% on the surface with the capital included. But compared to its historical data (as seen in the second chart below), such a DY is near the top level in a decade.
Source: Vanguard.com
Source: author based on Vanguard.com data
Risks-free rates
We use the following market dashboard to assess the valuation of different market sectors benchmarked against the risk-free rates. As detailed in our original article:
As top-down investors, we first check the market at a sector level to see the forest and then check a few leading stocks to see the trees. The mechanics of the market dashboard are detailed in our earlier article here and you are welcome to download it here.
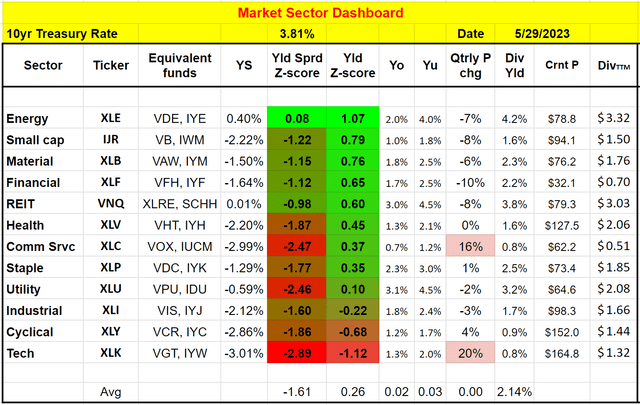
The following is what our dashboard shows. As seen, the REIT sector is now in the top 5 of the most attractively valued sectors in terms of its DY. When I wrote my original article last July, it ranked as one of the least attractively valued sectors.
There is also a large improvement in the sector’s risk premium when benchmarked against risk-free rates. To wit, the sector’s yield spread relative to 10-year treasury rates is still in the negative (with a Z-score of -0.98). However, all sectors currently feature a negative YS except the energy sector as seen. And the REIT sector’s YS is the second thickest among all market sectors (again, after the energy sector only), signaling minimal risks premium relative to other market sectors.
Looking forward, I also see the probability of further rate hikes today as much lower than that back in July 2022. As such, I see the pressure from interest rates raises much released now than about 1 year ago to the sector.
Source: Author
Risks and final thoughts
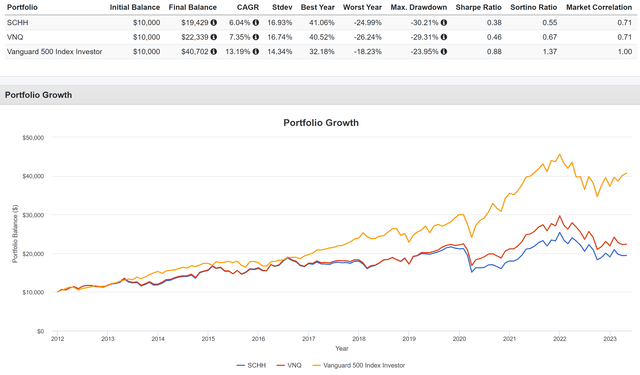
Roth funds entail several risks. First, performance risks. Both SCHH and VNQ have delivered relatively healthy returns in the past. However, both funds lagged the overall market as seen from the chart below. To wit, SCHH’s returned a total return of 6.04% CAGR and VNQ returned 7.35%, both lagging the S&P 500’s 13.2% by a good margin. Second, volatility risks. Even though REITs are widely considered a “safe haven” sector, they actually suffered substantially higher volatilities than the overall market as seen in the chart below. Measured by standard deviation, VNQ, and SCHH’s historical volatility was both on average 17%, almost 20% higher than the overall market’s 14.3%. Measured by maximum drawdowns, both VNQ and SCHH have suffered a maximum drawdown of close to 30%, about 25% worse than the overall market’s 24% since 2012.
However, REITs are indeed “safer” in the sense of their consistent dividend payouts and the hard assets behind the shares. And especially when purchased at times with attractive valuation, they also offer favorable odds for price appreciation. And the goal of this article is to argue that now is such a time. Due to the price corrections and much higher dividends since last July, both VNQ and SCHH now provide very attractive valuations. In terms of yield spread, I also see the pressure from further rate hikes much lower than 1 year ago.
Source: Portfolio Visualizer
Read the full article here


