Biden and McCarthy agree to a deal. The economy is saved! so now we march to 4300+ right? Um No.
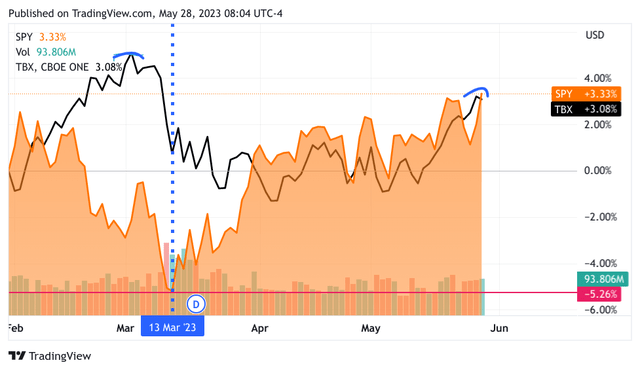
I suspect that my long-time readers might be surprised that I would say that I am bearish for any reason. I believe or at least there is a good chance that this will be a short correction period and that the rally continues. I have stated many times that patterns repeat, and we are about to repeat a very precipitous phase echoing the ides of March. Not only is there a distinguishing pattern there are also fundamental factors that will influence stocks very shortly. Fortunately, we should have some kind of relief rally now that a deal between the principal negotiators has been agreed to. I have already trimmed a lot of my long positions, too early as usual. The US indexes are up moderately, so far there is no concern regarding the pattern I have surfaced in this year-to-date chart below.
TradingView
Here is the inverse 7-to-10-year treasury ETF (TBX) overlaid with the S&P 500 ETF (SPY). I’m using the inverse because it is tracking the price of the bonds. When bond prices go down the interest rates go up, so that is why I’m using TBX. We see these bonds hitting a peak and pressuring down stocks throughout the rise. Once the stock market starts to hit bottom the interest rates come down because fearful traders and investors are piling into the bonds (pushing up the price, and lowering the interest rate). the steepest part of the turn-in rates coordinates with the mid-march annihilation of stocks. Now look at the left, so far the market is ignoring the interest rates. I believe interest rates are going to continue to rise because the supply of new bonds will have to be sold with higher interest rates because the treasury will have to make all those bonds higher priced to attract buyers – the old law of Supply and Demand One final thing, it’s not the level of interest rates it is the speed that it gets there. The black line represents the interest rate using the movement of TBX. So look at the left side of the chart and how quickly the long-end rose until the market finally rolled over and dove down hard
Your counter-argument could be, hey the interest rates have been moving up and the market doesn’t care. Well, that is a very good point. A big rule of mine is that patterns repeat. My error in assuming that the rally in equities had smooth sailing what that I didn’t take what happens when the credit ceiling deal is done.
At some point, market participants will care. Just as the market did in March when it retested 3800 (a low of 3808 on March 13) on the S&P 500. This is a ten-plus percent drop from the current level and is likely to be higher on the relief rally starting tomorrow.
Biden is expected to be able to sign a bill for a debt deal before June 5. According to Bloomberg News yesterday the Treasury already has at least more than $100B treasury debt to sell this week. This is hard to understand but supposedly the auction is all ready for Tuesday. Tuesday and Wednesday alone will have over $100B in T-Bills and Bonds. Thursday and Friday have a slew of short-term T-bills to be auctioned. How can they do that without the bill being signed into law? This is out of Bloomberg News so they do have credibility. In any case, this is just the beginning, and I expect nearly $1T to hit the credit markets in short order. It is likely that there is now less than $40B left in treasuries coffers. Once it hits $30B there will be no way the US cannot default. Today Bloomberg announced that $600B in debt will quickly hit the credit market in the ensuing weeks.
So let’s put this all together, the fundamentals with the chart patterns
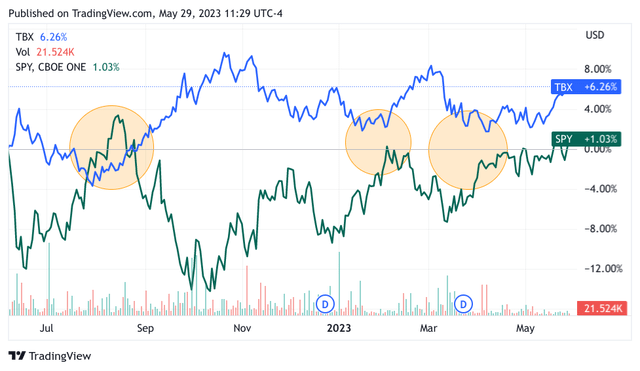
We have the previous pattern of the market reaching for new interest rate highs on the long bond and the equity market retreating. It took a few months of sideways motion before equities started to rise back up. This is not a pattern that goes back just to March. If you go back more than a year ago when interest rates started to rise this was an oft-repeated pattern. The 10-Y would make a new high, taking down equities, then retreat, in which time the equity market returned. Once again the 10-Y would rise, and this time equities didn’t react so quickly until the rate rose much further, and closer to the old high, before it retreated. Let me use the one-year chart TBF again to illustrate. This time with the SPY but just the 2 lines and let’s see if we can discern the pattern I am describing from memory.
TradingView
Well, it turned out not to be exactly as I remembered but I think it is still useful. The blue line is the TBX and the green is the SPY. At the extreme left, we see the interest rate spike and the SPY fall hard. The SPY rises back up as the interest rate moderates, then the rate returns to rising but so does the SPY. At some point in the rate rise stocks return to falling and falling hard as the interest rate finds a higher level. The circles attempt to illustrate how this pattern is repeated, or at least rhymes with the previous occurrence. The chart takes us to the current situation where the SPY rises after its nadir of March 13 as the interest rate falls after the previous peak.
We’ve been going sideways until recently and now reaching back to old highs
The current gestalt of interest-rate action has been affected by the Fed signaling that the rate-rising regime was slowing as it went from 0.75% to 0.50%, to the normal 0.25% rise. The last one was characterized as a rest in rising rates. So we see the great sideways movement in stocks with a small upward slope that has been in our market for about 3 months. Now interest rates for the last several weeks have been on the market but stocks are happily moving back to previous highs step-by-step. The market has been so bullish that it shook off the Crypto-Klepto SBF, the banking crisis with a few of the biggest bank failures in US history, and now the Debt Ceiling crisis which roiled the market for a few days last week. But now we hear that more rate increases are coming sooner than expected, and as I noted a humongous pile of debt will hit the market acting as further QT – Quantitative Tightening, the still existing regional banks already with tighter lending standards. We don’t know if during this interregnum whether any of the regional banks sold or otherwise hedged their pile of low-interest bonds or not. We could be confronted by renewed failures, or the commercial real estate market will have new casualties or not as well. That aside, simply the act of the 10-Y reaching toward 4% very quickly and then marching past 4.5% at this heightened pace should perturb the market at least as much as in mid-March. My thesis is that we retest 3808 fairly soon. This is so not my usual outlook, but if I can’t learn from my previous mistakes I am not much good to myself let alone all my loyal readers whom I continue to appreciate.
So what to do?
This week I spent most of my time trimming positions and setting aside cash. I also had a lot of Puts against the Nasdaq-100 and the S&P 500. My intention was to close out my short positions Thursday evening or Friday and go long. This was in anticipation of good news over the weekend. Then the NVDA moonshot happened, and as often happens with “The best-laid schemes o’ mice an’ men” (thank you Robert Burns) I didn’t get to close out my profitable short trades. Instead after much cogitation, I decided to add to my short positions in anticipation of the rapid rise in rates as a result of the debt agreement. I know that I continuously warn you about turning a trade into an investment and staying with a position subconsciously hoping the stock will go your way. Perhaps if this notion proves to be false, and I take a massive hit for my folly, at the very least it will serve as a lesson to do as I say and not as I do.
Good Luck with the markets everyone, I know I will need it.

Have you ever bought a stock that everyone’s saying is great, only to find you bought near or at the all-time high that stock drops 20% immediately? What happened? By the time the average stock purchaser gets a stock idea, usually, it’s already overbought.
If this sounds like you, join our community Group Mind Investing which adheres to a Cash Management Discipline. We watch the market for you and uncover fresh trading and investing ideas. We identify sectors, trends, and individual stocks. You learn how to target a stock, buy and sell. Try our 2-week trial
Read the full article here


