Dividend stocks feel left for dead this year. After producing strong relative performance in 2022 amid the tech selloff, this year’s rebound in growth equities has relegated value-oriented dividend blue chips to the backburner on investors’ radars. Putting some numbers to that, the high dividend yield factor is underperforming the S&P 500 by more than 13 percentage points YTD.
Factor Fallout: Dividend Stocks Sour in 2023
Koyfin Charts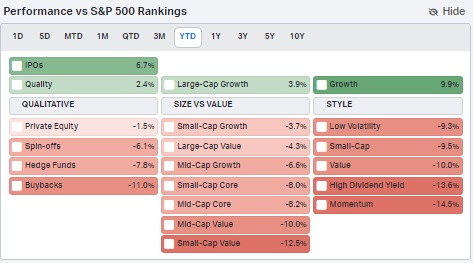
Further underscoring how poorly dividend yielders have traded in 2023, take a look at the below YTD ETF performance heat map. US large-cap growth funds are higher by 20% or more while the value style is about flat. One of the weakest returning dividend ETFs is the iShares Select Dividend ETF (NASDAQ:DVY). It is down more than 9% in 2023. I’m a hold on DVY due to poor momentum right now, but I will highlight key support that’s currently in play.
DVY: Among the Worst Broad ETFs YTD -9%
Finviz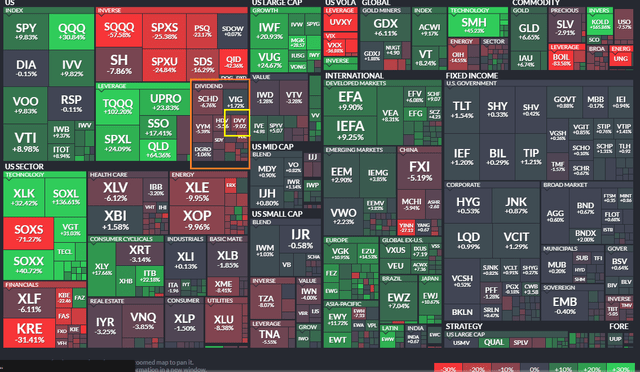
According to the issuer, DVY seeks to track the investment results of an index composed of relatively high dividend-paying U.S. equities. It offers broad exposure to broad-cap U.S. companies with a consistent history of dividends and access to 100 U.S. stocks with 5-year records of paying dividends.
DVY sports a modest 0.38% annual expense ratio and pays a high 3.9% trailing 12-month dividend yield. With total assets under management of $19.7 billion, it is among the largest dividend-theme funds traded. Average daily volume is high at nearly 600,000 shares (considering the $109 share price) while the 30-day median bid/ask spread is just four basis points; so tradeability is strong.
DVY’s standard deviation is 17% on a 3-year basis, slightly lower than that of the S&P 500. On valuation, the price-to-earnings ratio as of May 25, 2023, is low at 11.3. According to Morningstar, more than 70% of the DVY allocation is considered value. The growth style is weighted at just 1% with the balance in blend. So, factor-wise, it’s far out on the value side of the value-growth spectrum while the yield factor is of course high. Earnings quality is not strong given exposure to riskier parts of the market. It’s also notably mid-cap oriented with more than half the portfolio mid-cap or small-cap.
DVY: Portfolio & Factor Profiles
Morningstar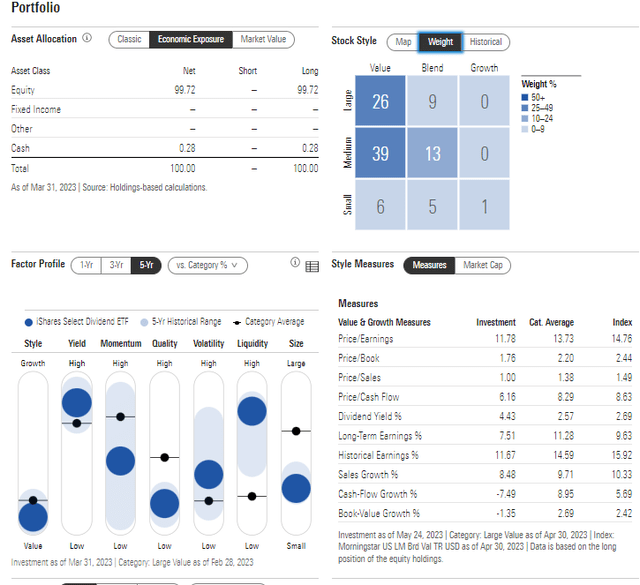
DVY has a massive overweight to the defensive Utilities sector, per iShares. Information Technology is just 4.4% of the portfolio (effectively, Utilities and IT swapped places in terms of weight compared to the breakdown of the S&P 500). Thus, the ETF is an active bet against growth in favor of defense.
DVY: Sector Breakdown
iShares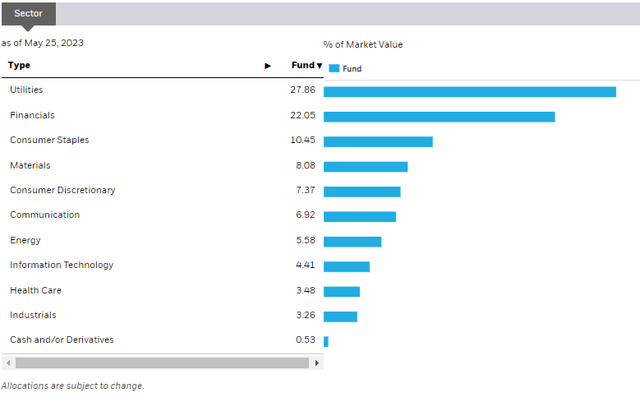
Seasonally, domestic dividend stocks tend to underperform the broader market from late May through the middle of July, so now may not be the most opportune time to establish a long position or add to DVY. Data from Equity Clock show that seasonal trends usually improve in Q3.
DVY Relative Performance Seasonality: Bearish June & Early July
EquityClock.com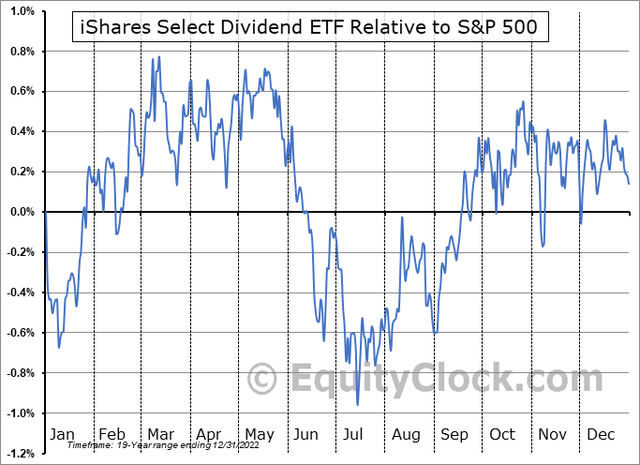
The Technical Take
Dividend stocks have suffered after notching highs more than a year ago. The factor was en vogue last year, but strong selling pressure in the last four months has resulted in a test of the rising 200-week moving average. Notice in the chart below that DVY is near critical support. Not only is that long-term moving average in play, but the early 2020 peak of $107.36 is being tested again.
The fund held the 200-week last October and this past March, so I see the $105 to $109 zone as key. A break under that would imply further declines, perhaps in the $88 to $92 range. DVY is down 6 straight weeks – something it has not done in the last 4 years, so momentum is on the side of the bears. Overall, it is a concerning chart, but DVY is also right at key support.
DVY: Descending Triangle, Shares Near Critical Support
Stockcharts.com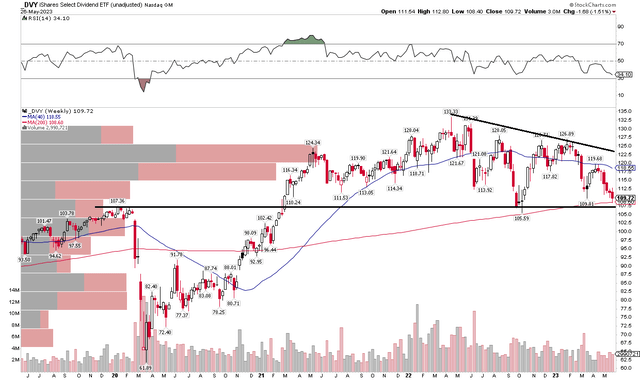
The Bottom Line
I am a hold on DVY. I like the valuation, but momentum is very weak with the fund. I’ll be watching the $105 to $109 area for long-term support.
Read the full article here


