Medifast Inc. (NYSE:MED), a leader in the weight loss industry, saw considerable share price fluctuation during the last few months. In fact, its stock price has gradually declined throughout 2023.
This could be due to many factors. For example, inflation has increased in 2023, and this has put considerable pressure on consumer spending.
Medifast’s products are usually more expensive than other weight loss and management options. As a result, they are more sensitive or vulnerable to changes in consumer spending.
In addition, Medifast is facing increasing competition from other weight loss companies and brands, such as Weight Watchers. These businesses have been investing significantly in marketing new products, making it more challenging for Medifast to maintain its market share.
Medifast is based in Baltimore, Maryland, USA. It’s engaged in the production, distribution, and selling of weight loss, weight management, and healthy living products and programs. The company uses OPTAVIA Coaches to help sell its products.
A decrease in the number of its active OPTAVIA Coaches is pinpointed as one main reason for the company’s revenue decline.
Medifast expects second-quarter revenue in 2023 to be between $250 million and $270 million. The second quarter diluted EPS in 2023 is expected to be between $1.32 and $1.44. The company has a history of beating analyst and market expectations. So, if this trend persists, it may lead to a higher stock price.
When considering these current stories about Medifast, we need to determine which news topics will have a long-term and ongoing effect on the company and its share price.
While current news stories, good or bad, can sway our opinion about investing in a company, it’s good to analyze its fundamentals and see where it’s been in the past and in which direction it’s heading.
This article will focus on the company’s long-term fundamentals, giving us a better picture of the company as a viable investment.
I also analyze the company’s value versus the price and help you determine if Medifast is currently trading at a bargain price. I provide various situations which help estimate the company’s future returns. In closing, I will tell you my opinion about whether I’m interested in taking a position in this company and why.
Snapshot of the Company
A fast way to understand the business’s condition is to use the BTMA Stock Analyzer’s company rating score. Medifast has an impressive company rating score of 85.12 out of 100. This score indicates that the company is performing well across various categories.
BTMA Stock Analyzer
Before jumping to conclusions, we must look into individual categories to see what’s happening.
Fundamentals
Analyzing the share price over the years, we can observe that share price has increased overall during the past 10 years. However, the past 2 years has seen a sharp decline in share price.
Overall, the share price average has increased by about 341.5% over the past 10 years, or a Compound Annual Growth Rate of 17.93%.
BTMA Stock Analyzer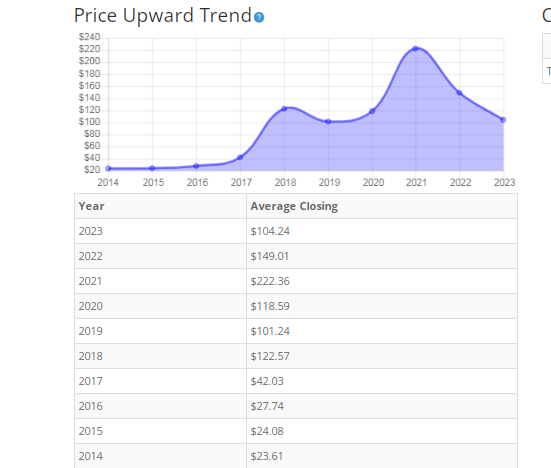
Earnings
By examining long-term earnings, we see that earnings have increased at an impressive rate over the past 10 years. There’s a slight decline in the recent year, but overall, the 10-year earnings growth is consistently improving.
BTMA Stock Analyzer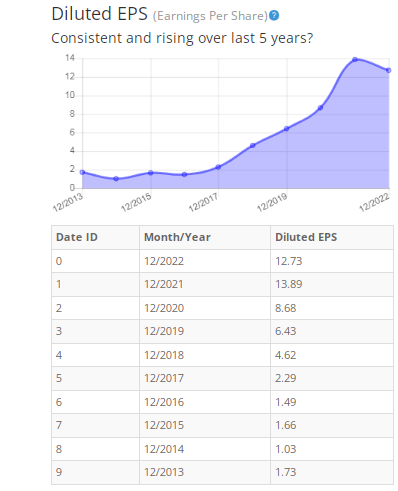
Return on Equity
Since earnings and price per share don’t always give the whole picture, it’s good to look at other factors like gross margins, return on equity, and return on invested capital.
Wow! Return on Equity is at exceptionally good levels. I typically look for return on equity (ROE) of 16% or more, so Medifast has far exceeded these levels.
BTMA Stock Analyzer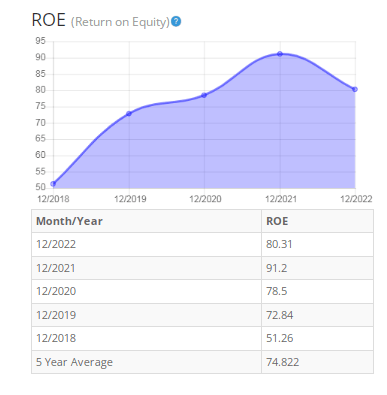
Return on Invested Capital
Return on Invested Capital has been just as impressive as ROE. For ROIC, I also typically look for levels of 16% or more. Therefore, Medifast’s average 5-year ROIC of 67% is outstanding!
BTMA Stock Analyzer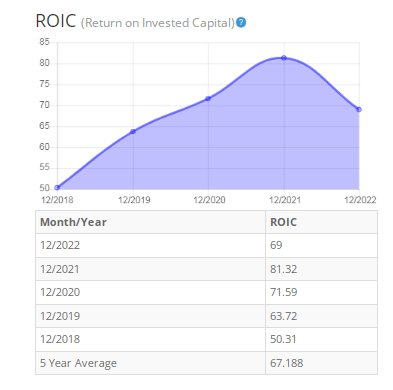
Gross Margin Percent
Don’t let this chart deceive you. Even though it shows Gross Margin Percent (GMP) declining, the levels are still well above standards. I typically look for GMP of 30% or more. Therefore, Medifast’s average 5-year GMP of 74% is fantastic!
I would still keep an eye on the GMP in the future to make sure that this declining trend doesn’t persist to decline. This could mean that the company is losing its ability to stay competitive or to maintain pricing power.
BTMA Stock Analyzer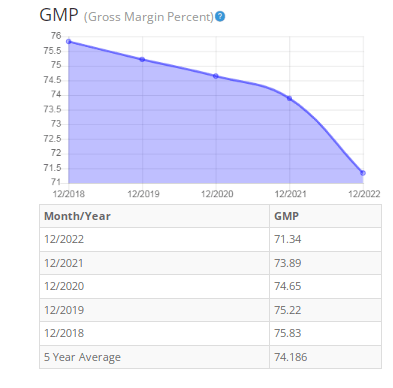
Financial Stability Indicators
Looking at other fundamentals involving the balance sheet, we can see that the debt-to-equity is less than 1. This is a good indicator meaning that the company owns more than it owes and that it is financially healthy in the long-term.
The company’s current ratio is above 1, indicating that it has more assets than current liabilities, which is a favorable sign. Generally, this suggest that the company has sufficient cash to cover its short-term obligations.
The dividend yield of Medifast is 7.22%. A high dividend yield such as this can be attractive to income-focused investors who seek regular income from their investments.
BTMA Stock Analyzer
This analysis would only be complete by considering the value of the company vs. share price.
Value Vs. Price
The company’s Price-Earnings Ratio of 7.5 indicates that MED might be selling at a low price when comparing Medifast’s PE Ratio to a long-term market average PE Ratio of 15.
The 10-year and 5-year average PE Ratio of MED has typically been 20.5 and 19.3, respectively. This indicates that MED could be currently trading at a low price when comparing to its average historical PE Ratio range.
BTMA Stock Analyzer
(Source: BTMA Stock Analyzer – Stock Value)
The Estimated Value of the Stock is $208, versus the current stock price of $82. This indicates that MED is currently selling at a bargain price.
For more detailed valuation purposes, I will be using a conservative diluted EPS of 12.73. I’ve used various past averages of growth rates and PE Ratios to calculate different scenarios of valuation ranges from low to average values. The valuations compare growth rates of EPS, Book Value, and Total Equity.
In the table below, you can see the different scenarios, and in the chart, you will see vertical valuation lines that correspond to the table valuation ranges. The dots on the lines represent the current stock price. If the dot is towards the bottom of the valuation range, this would indicate that the stock is undervalued. If the dot is near the top of the valuation line, this would show an overvalued stock.
BTMA Wealth Builders Club BTMA Wealth Builders Club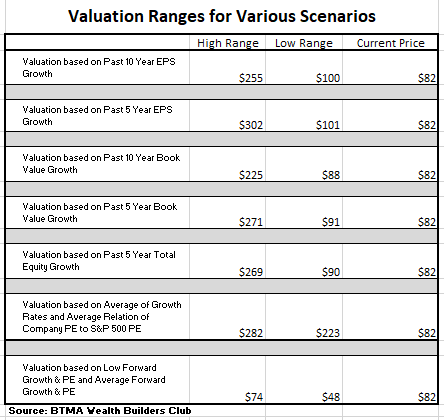
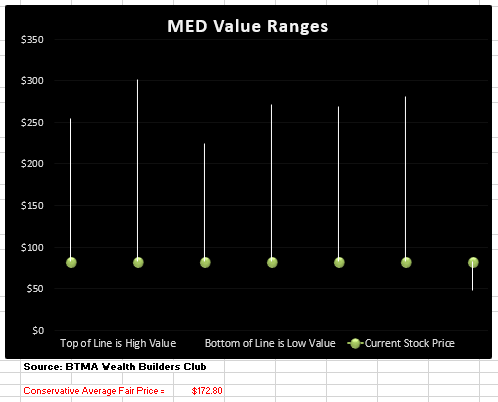
According to this valuation analysis, MED is undervalued when considering all past growth averages. It’s also undervalued when considering its current and forecasted PE ratio to MED’s average PE Ratio.
However, when considering MED’s future analyst growth forecasts, MED is overpriced. Analyst forecasts estimate a value range of around $48 to $74.
Summarizing the Fundamentals
The company’s fundamentals are very impressive across the board. Earnings has been consistently increasing, ROE, ROIC, and Gross Margins are all at extraordinary high levels.
The company’s balance sheet shows that Medifast is financially healthy in the long and short-term.
Now, we will compare Medifast as an investment versus the market benchmark (S&P 500).
Medifast vs. the S&P 500
The chart below shows us that Medifast has been able to keep in pace with the S&P 500 or to greatly outpace the market during most of the past 10 years.
This is a good sign showing us that Medifast has great growth potential as an investment. Notice how Medifast’s price has almost fallen back to the level of the S&P 500. This could indicate that now could be an opportune time to buy MED at a historically low price.
Morningstar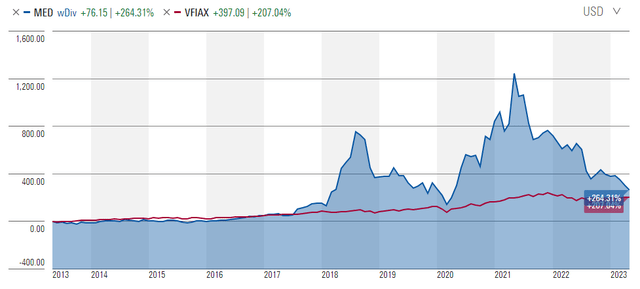
Forward-Looking Conclusion
“Over the next five years, the analysts that follow this company are expecting it to grow earnings at an average annual rate of 20%.
On the other hand, the average one-year price target for this stock is at $71, which is about a -13.5% decrease in a year.
Does Medifast Pass My Checklist?
- Company Rating 70+ out of 100? YES (85.12)
- Share Price Compound Annual Growth Rate > 12%? YES (17.93%)
- Earnings history mostly increasing? YES
- ROE (5-year average 16% or greater)? YES (74.8%)
- ROIC (5-year average 16% or greater)? YES (67.1%)
- Gross Margin % (5-year average > 30%)? YES (74.1%)
- Debt-to-Equity (less than 1)? YES (0.16)
- Current ratio (greater than 1)? YES (1.58)
- Outperformed S&P 500 during most of the past 10 years? YES
- Do I think this company will continue to successfully sell the same main product/service for the next 10 years? Probably
Medifast scored 9.5/10 or 95%. Therefore, Medifast is an option worth considering as a potential investment.
Is MED Currently Selling at a Bargain Price?
- Price Earnings less than 16? YES (7.5)
- Is the estimated value greater than Current Stock Price? YES, however the analyst’s forecasted value indicates that MED is currently overpriced.
For me, the choice is certain. If I were not holding Medifast, I would add it to my watchlist. Since I’m already holding Medifast, I will hold onto it and potentially buy more if it falls to an exceptionally low price.
As a holder of Medifast, I can rest assured, knowing that I’m holding a very fundamentally solid company in strong financial health. I will simply continue holding and collect the dividend while I wait for the share price to climb back up past my buy price to achieve my desired gain. It seems like Medifast is currently facing some headwinds and it could take a while to start gaining traction. But, I’m willing to hold patiently and wait for the stock price to increase again.
Read the full article here


