This article was first released to Systematic Income subscribers and free trials on May 18.
The price action in bank preferreds has been one of the livelier parts of the income market not just because of the elevated volatility but also because of the level of disagreement among investors. Some investors are anxious about further air pockets while others are actively adding to beaten down assets.
We structured this article a little differently than usual. Rather than going through a single narrative, we thought it made more sense to focus on a number of misconceptions or naive heuristics (i.e. the seven deadly sins) that some investors may have regarding the recent fallout in regional bank preferreds in the context of preferred CEFs.
1. Is Your Fund Overweight Or Underweight Bank Securities?
Let’s kick it off with a question that came up on the service of whether investors should be wary of a fund like the John Hancock Preferred Income Fund II (HPF) in the context of the recent bank tantrum and the price declines across preferred stocks.
This question struck us as odd for the simple reason that HPF, as well as its two sister funds, is actually a preferred-lite CEF. Unlike the other CEFs in the sector, HPF holds barely half of its portfolio in preferreds with most of the rest in corporate bonds. It’s true that within this corporate bond segment there is a 13% (of the entire portfolio) allocation to bank bonds (which appear to be subordinated bonds), however, even if we add that to the financial preferreds, we still have a fund that is relatively underweight banks or financials relative to the rest of the preferred CEF sector.
In short, yes, HPF does have exposure to financials and banks, however its exposure is among the lowest in the broader preferred CEF sector. The key takeaway here is that it’s a good idea to have a sense of whether any given preferred CEF is overweight or underweight bank securities. Failure to come to grips with this may give investors a wrong sense of their actual exposure to further downside (or upside) in the sector.
As a sidenote, we were wary of HPF (and its sister funds) much more because of its enormously expensive valuation. The left-hand chart below shows that its premium hit 10% recently (even as the broader sector valuation was at a high single-digit discount). This deflated very sharply over the last couple of weeks, though the fund remains expensive.

Systematic Income CEF Tool
2. Financial Exposure Is Not The Same As Regional Banks
Given the often dire commentary around the sector, it’s easy to conflate “financial” exposure with regional banks which have borne the brunt of the recent losses.
The reality is that the financial sector is very diverse and regional banks make up a very small portion of it. It includes credit unions, too-big-to-fail banks, international banks, insurance companies, financial product/annuity companies, custody banks, asset managers, investment banks, consumer credit companies, farm credit system banks and cooperatives and others. Clearly, most of these sub-sectors have nothing to do with the difficulties faced by a number of regional banks.
Moreover, some of these institutions have actually benefited from the recent bank tantrum, most notably the large US (and the larger regional) banks which have grown deposits and swallowed up the choice morsels of failed banks at a knockdown price.
3. Problematic Bank Exposure is Now Smaller
Another important feature of the current preferreds CEF sector is that bank exposure, particularly to vulnerable banks, is now a lot smaller than it was at the start of the year.
To state the obvious not only have a bunch of regional bank preferreds gone to zero (e.g. FRC, SVB, SBNY, SI), but a number of other ones have deflated sharply.
This means that preferred CEFs are now carrying significantly less exposure to this troubled area of the market. Although this reduction in exposure has been painful for investors who have held the affected securities since the start of the year, it doesn’t change this fact.
A corollary here is that investors need to be careful gauging their exposure to banks (regional or otherwise) from CEF fact sheets or holdings reports. These documents are usually very lagged. Any document issued before March will show a higher exposure than the fund has today.
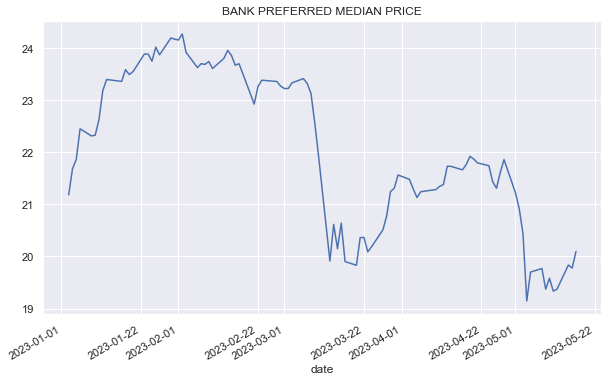
As the chart below shows, the median bank preferred price has fallen from $23 at the start of March to around $20 today. That’s a drop of 13% across the entire bank preferreds sector. However, this drop hides the bifurcated nature of the market where preferreds of the larger banks have barely moved while those of the affected banks have fallen by twice this amount or more.

Systematic Income
4. Be Clear On What’s Driving Preferred CEFs
Although most investor anxiety in this sector is focused on regional bank preferreds, this is not the only, or even the most important, driver impacting preferred CEFs. Specifically, there are two distinct drivers of performance: regional banks and contingent convertible bonds. If we can put a face to the name we would say the two distinct problems are Silicon Valley Bank and Credit Suisse.
The issue with regional banks (i.e. rising rates, unrealized bond losses, sizable amount of uninsured deposits, depositors moving their money to higher interest-bearing assets like Treasuries etc.) is well known. The issue with contingent convertible bonds or CoCos is less so, primarily because these bonds are issued by non-US banks. The zeroing out of Credit Suisse CoCos by regulatory fiat cast a pall over the sector and, although it has recovered somewhat since then, it remains well below its pre-March levels.
If we take the largest preferred CEF – the Nuveen Preferred & Income Securities Fund (JPS) – as an example, we can see that regional banks are about 10% of the fund’s portfolio but contingent convertible bonds are around 33%.
In short, to slightly complicate the situation around preferred CEFs, investors need to consider all key drivers of performance in their allocation to preferred CEFs.
5. Regional Bank Exposure in Preferred CEFs is Small
Given the sometimes hysterical commentary about preferred CEFs, investors may be forgiven to think that regional banks dominate preferred CEF portfolios. The reality is very different.
If we dig into the portfolio of one of our holdings – the Nuveen Preferred and Income Term Fund (JPI), we can have a look at the table below. Regional banks are highlighted.

Systematic Income
What’s clear is that regional banks are not in the fund’s largest positions (and not only because they have recently sold off). Most of the regional bank exposure is not only towards the tail end of the portfolio but also fairly low in absolute terms.
The fund’s portfolio is dominated by larger banks, international banks and non-bank companies, whether financials or otherwise.
6. Don’t Buy Until the Crisis is Resolved?
Some of the advice investors are receiving on preferred CEFs is to get out of the sector until the ongoing crisis is resolved.
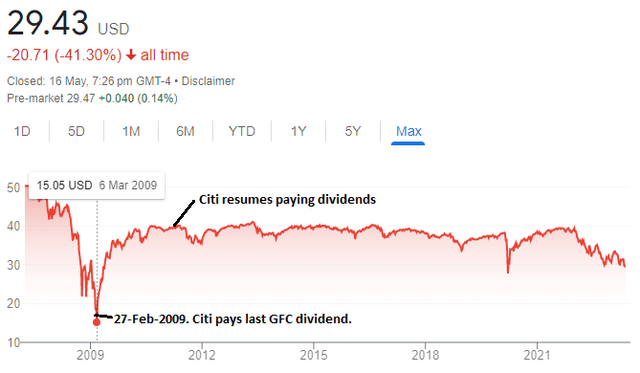
In our view, an important component of any investment decision is to see how well it’s worked in the past. Let’s circle back to the previous bank crisis during the GFC. Investors who sold at the point where banks started to suspend dividends (recall FRC suspended its dividends prior to being taken over by JPM) would have sold near the lows. If they then waited for the “all-clear” when dividends were reinstated they would have locked in enormous losses.

This example is not exactly scientific and it’s arguably unfair to single out Citibank, but it’s the institution that was, arguably, most on the cusp in the GFC among the better known banks.
Apart from this example, the broader point is that selling in a period of elevated anxiety and market volatility only to buy back when things have calmed down is a recipe for selling low and buying high. Do this a few times and soon enough there won’t be much of a portfolio left. This doesn’t mean that investors should never sell at a loss but rather that it’s important to balance the risk of both downside and upside.
7. Buy the Banks and Get the Non-Financial Weakness for Free
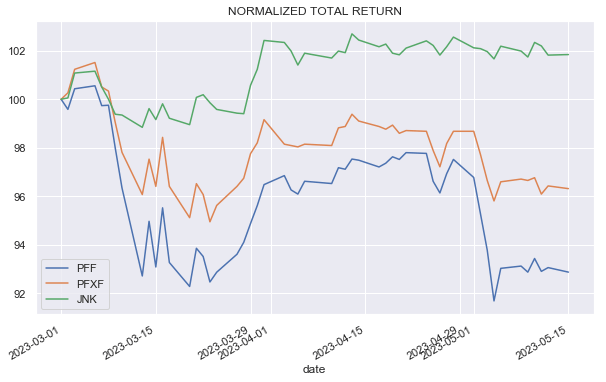
An important point about the recent performance of preferred CEFs is that not all of the recent drawdown was due to banks. If we look at the breakdown below of corporate bonds (JNK), preferreds (PFF) and non-financial preferreds (PFXF) we see that some of the weakness in bank preferreds (that we see in PFF) carried over into non-financial preferreds (that we see in PFXF). This is at the same time that corporate bonds have actually rallied.

Systematic Income
This kind of pattern is fairly common in markets since asset correlations have risen over time. Even though non-financial preferreds are removed from any weakness in banks, they are still affected by the proximate weakness in bank preferreds.
This is very likely due to investors bailing out of preferred funds for fear of bank preferreds and the funds selling preferreds across the entire sector. However, because non-financial preferreds are not in danger of failing from the same thing that’s affecting some banks, investors can take advantage of bank weakness to add to non-financial preferreds at a more attractive price. This can be through diversified preferred funds, individual preferreds or PFXF.
Takeaways
Typically, rules-of-thumb or heuristics can help investors navigate the income market. However, sometimes they are too simplistic to be helpful and can actually lead investors astray. In this article we highlighted a number of these misguided ideas in the context of regional banks and preferred CEFs.
In the preferred CEF sector we continue to like the Cohen preferred CEFs due to their low level of leverage cost, lack of leverage caps and wide discounts. We currently favor (LDP) in the Cohen suite which trades at a 9.6% distribution rate and a 10.2% discount.
A Nuveen preferred CEF (JPI) also remains in our holdings primarily because of its term structure. Nuveen has consistently allowed investors an exit at the NAV for their term CEFs whether through termination (e.g. JEMD) or a tender offer at NAV (e.g. JPT).
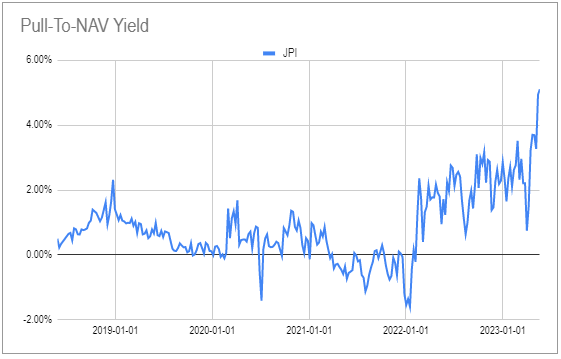
The fund’s pull-to-NAV yield is at the highest level over the past five years of 5% annualized. This metric is just the fund’s discount (i.e. 6.5%) annualized to its expected termination date in Aug-2024. This is the additional tailwind its price is expected to enjoy over this period relative to the NAV. Of course, if we see further volatility in the banking sector we could easily see a negative total price return even with this tailwind but the additional performance will still help.

Systematic Income CEF Tool
Read the full article here


