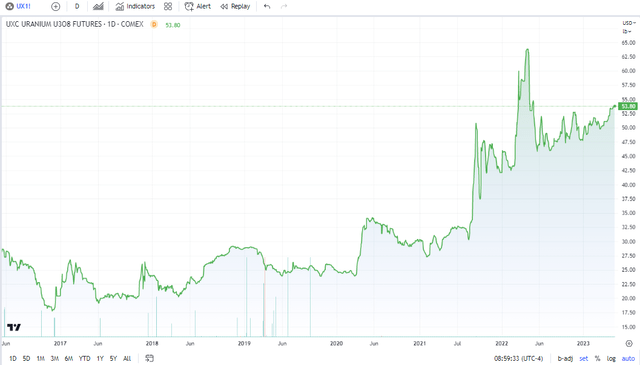
Uranium prices are up sharply across many timeframes. The industrial-heavy commodity is below its spike high from a year ago, but a firm uptrend is apparent when zooming out several years. With nuclear power popularity growing amid geopolitical uncertainty and the re-shoring trend (part of the energy independence theme), uranium demand is seen as strong over the coming years. Still, macro risks linger with ebbing economic growth concerns.
I have a hold rating on Sprott Uranium Miners ETF (NYSEARCA:URNM) based on a so-so valuation, poor seasonality in the industry, and a mixed chart.
Uranium’s Bull Market Last 6 Years
TradingView
According to the issuer, URNM is the only ETF to provide pure-play exposure to uranium miners and physical uranium essential to nuclear power. URNM seeks to invest at least 80% of its total assets in securities of the North Shore Global Uranium Mining Index (URNMX). The index is designed to track the performance of companies that devote at least 50% of their assets to the uranium mining industry, which may include mining, exploration, development, and production of uranium, or holding physical uranium, owning uranium royalties, or engaging in other non-mining activities that support the uranium mining industry.
URNM has $855 million in assets under management as of May 19, 2022, and features a somewhat high annual expense ratio of 0.85%. What you get by owning the ETF is a pure-play uranium company fund with broad international exposure. Investors bullish on the clean energy transition may be attracted to this fund. Having only been in existence since late 2019, there isn’t a long track record, but the bullish thesis is that a new bull market in uranium is underway.
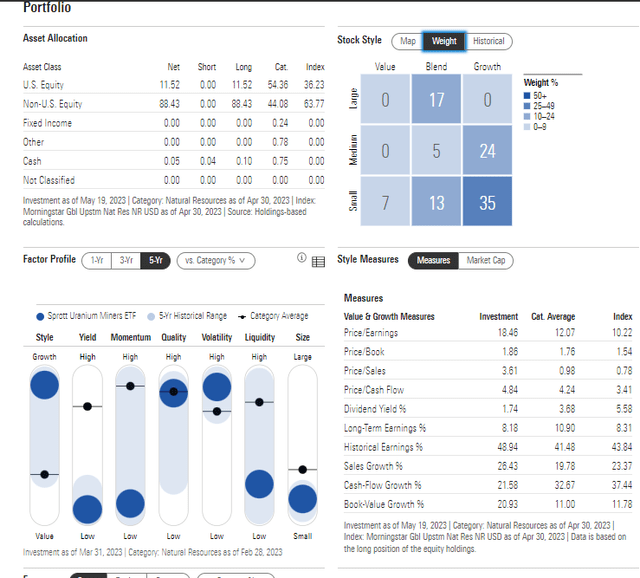
The Morningstar Style Box shows that the market cap and style breakdown are rather mixed. The plurality of URNM falls in the small-cap growth box, so it will be susceptible to macro factors like interest rates and broad economic growth outlook changes. Only 7% of the fund is considered value.
Morningstar also points out that 90% of the ETF is within the Energy sector, with 10% in Materials. The yield and momentum factors are both low, while quality and volatility are high. On valuation, URNM is much more expensive than the broad energy sector at more than 18x earnings and nearly 5x free cash flow. While earnings growth is high, those are lofty valuation metrics.
URNM: Portfolio & Factor Profiles
Morningstar
URNM: A Concentrated Portfolio
Holding 37 securities, the weighted average market cap of the ETF is $4.0 billion with a high 56% exposure to small caps, per Sprott ETFs. Approximately 17% of the allocation is in physical uranium with the balance invested in uranium and related equities.
Sprott ETFs
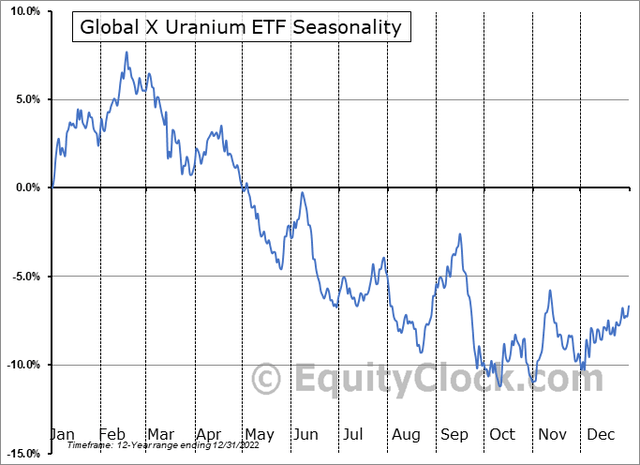
Seasonally, since URNM has a limited price history, I took a look at trends on the Global X Uranium ETF (URA). The fund tends to struggle through early October, though much of the damage often takes place from mid-February through late May, according to data from Equity Clock. This is a bearish piece of evidence, but is not a core part of the investment thesis.
Uranium Equity Seasonality: Bearish Through Early Q4
Equity Clock
The Technical Take
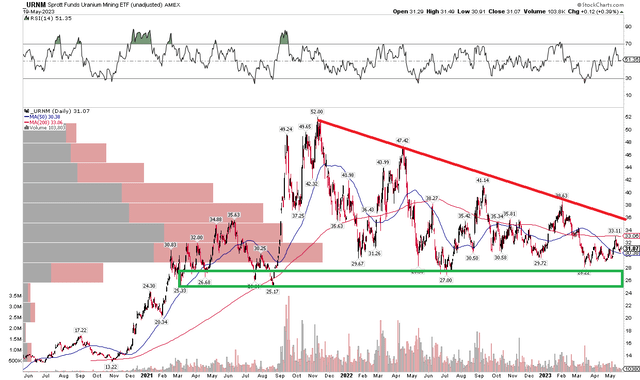
With a high valuation and potentially unfavorable seasonals, the technical picture is neutral to bullish. Notice in the chart below that shares remain in a consolidation off the all-time high notched in late 2021. This is slightly bullish since it would be considered a continuation pattern – which is actually higher considering the previous uptrend that began in 2020. But the crux here is that the $25 to $27 range must hold as support.
If that breaks, then there is not much support until the low teens. I also find that volume is on the decline since Q2 2021, so it underscores that the fund is coiling up here. With a flat 200-day moving average, the trend is down, but not sharply so. A rally above $36 would help support a breakout. For now, it is wait and see.
URNM: On Ongoing Consolidation, Watch For A Breakout Or Breakdown
StockCharts.com
The Bottom Line
I am a hold on URNM. The valuation is not cheap compared to other Energy sector funds and the expense ratio is high. Also, seasonals are soft, and the technical picture is mixed right now – watch for a break from this consolidation pattern.
Read the full article here


