The next figure shows asset class performance for all of 2022 and year-to-date in 2023. The first part of the figure contains ACWI, a global stock market index, and several U.S. stock market indexes. Next come the performance of commodities and of an S&P Risk Parity strategy. Following this are the returns on fixed income asset classes. At the bottom of the figure are the returns of the U.S. dollar against a basket of global currencies, as well as indexes of international stock and bond returns. A description of each asset class is given at the end of this article.
Year-to-date asset class performance in 2023 (orange bars) and full-year performance in 2022 (blue bars). Please refer to the Key to Data section for an explanation of all the series. (QuantStreet, Bloomberg)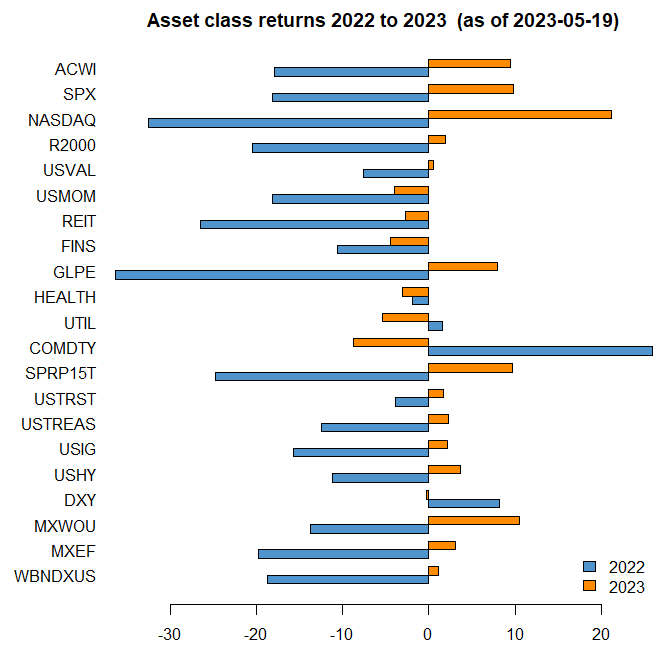
Across the board, 2023 has been a better year for risk assets than 2022. Not everything is up on the year, but the major asset classes are, including the S&P 500, the ACWI (MSCI All Country World Index), risk parity (SPRP15T), as well as fixed income. For the most part, 2023 has so far seen a reversal of the return performance of 2022. The commodity sector, the biggest winner of 2022, has been the biggest year-to-date loser. Most stock indexes which were down in 2022 are up in 2023. Likewise, fixed income asset classes, which were down in 2022, have bounced in 2023.
Detailed Observations
In this section, we do a deeper dive into some individual asset classes with an eye on what comes next.
NASDAQ
The best performing major asset class in 2023 is the NASDAQ, which is heavily exposed to technology firms. The NASDAQ was particularly hard hit in 2022 for two reasons. First, the index consists of fast-growing companies with long-dated cash flows, which are particularly sensitive to the rate rise of 2022. Second, the NASDAQ is a more volatile index than the S&P 500 and tends to amplify the swings in the overall market. In 2023, as rates have fallen, the NASDAQ has benefited. Furthermore, because the NASDAQ’s cash flows are longer dated, an anticipation of a late-2023 recession is less bad for the NASDAQ than it is for high current cash flow firms, like utilities (which have done poorly so far in 2023). Finally, much has been made about the stunning advances in artificial intelligence that we are seeing almost weekly in 2023. Without getting into long-term prognostication on this topic, our view is that these technologies will be transformative for productivity in the short-term, and all the obvious beneficiaries (MSFT, AMZN, AAPL, GOOGL, META, NVDA) are the largest NASDAQ stocks. These trends are likely to continue for the rest of 2023.
USMOM, USVAL, REIT, FINS
These four asset classes (momentum, value, REITs, and financials) have been the major equity laggards year-to-date in 2023. The momentum stocks portfolio held the 2022 winners, and these have been the largest losers so far in 2023. Value stocks, heavily exposed to financials and healthcare and underweight technology, have been in precisely the wrong sectors in 2023. The issues with REITs – heavy reliance on regional bank funding and the impact of post-COVID work-from-home trends on commercial real estate (CRE) — are well documented. This year’s Silicon Valley and First Republic fiascos, and the associated deposit flight from regional banks, have contributed to underperformance in financials. None of these trends is likely to change any time soon.
SPRP15T
The S&P risk parity index, which has an 85% risk allocation equally split between equities, fixed income, and commodities, and a 15% risk allocation to Treasury Inflation Protected Securities (TIPS), did surprisingly poorly in 2022, likely because of its large fixed income exposure and despite being long commodities, but has bounced back in 2023. (The 15 in the index name means the index targets a 15% realized annual volatility).
COMDTY
Commodities, and especially oil prices, have had a terrible year in 2023. The culprits are numerous. First, Russia supply appears far more resilient than had been anticipated. Second, energy markets reflect an anticipation of a late-2023 recession brought on by the Fed’s tightening cycle. Finally, speculator positioning has become extremely negative, as the next chart shows.
QuantStreet, Bloomberg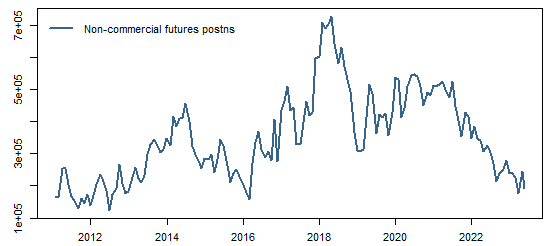
We wrote around the start of the year that there are reasons to think that oil prices will go higher in 2023. That certainly has panned out, but many of the factors we cited sill apply, making a spike in energy prices a potential surprise for later in 2023.
USTRST, USTREAS, USIG, USHY
2022 was a year of rising rates as the Fed tightened policy to stave off inflation. With concerns about bank risk and a growth slowdown in late-2023, rates have fallen from their 2022 peaks. Even with the rate increase over the last few days, market consensus anticipates the Fed will pause its rate hiking cycle, and even ease later in the year. As rates fell, fixed income asset classes rallied, including U.S. investment grade and high-yield corporate bonds. Investment grade ETFs (LQD, VCIT) have large allocations in bank bonds, and with the bank stress over the last few months, investment grade bonds have slightly underperformed Treasuries. This trend is likely to continue for the rest of 2023 as the banking tremor continues to reverberate.
10-year Treasury yields. (Bloomberg)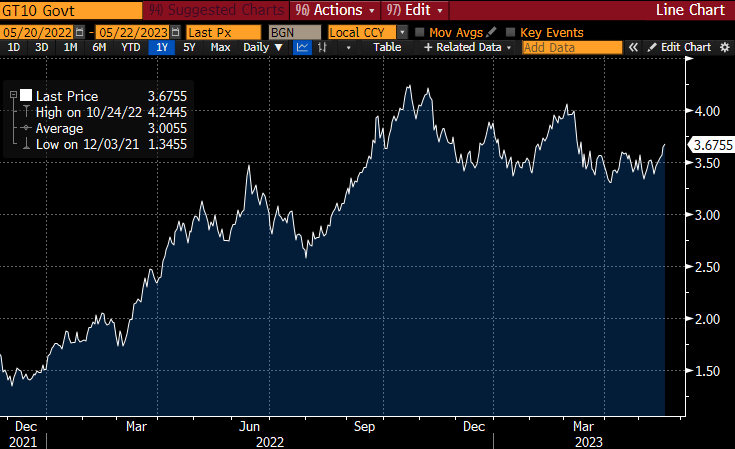
DXY
As the Fed raised rates more aggressively than global central banks in 2022, U.S. interest rates appeared attractive (i.e., higher) relative to other developed economies. With U.S. banking issues and anticipated easing by the Fed, the interest rate differentials have fallen, and the dollar has sold off. In our view, the Fed remains several months to quarters ahead of other central banks in its monetary policy cycle, which suggests further dollar weakness (because U.S. interest rates will fall relative to global peers), but also a growth rebound in the U.S. that will lead other countries. This will be a mixed bag for U.S. relative to foreign stocks, as U.S. corporate earnings may lead the rest of the world, even as the dollar stays weak.
Dollar index. (Bloomberg)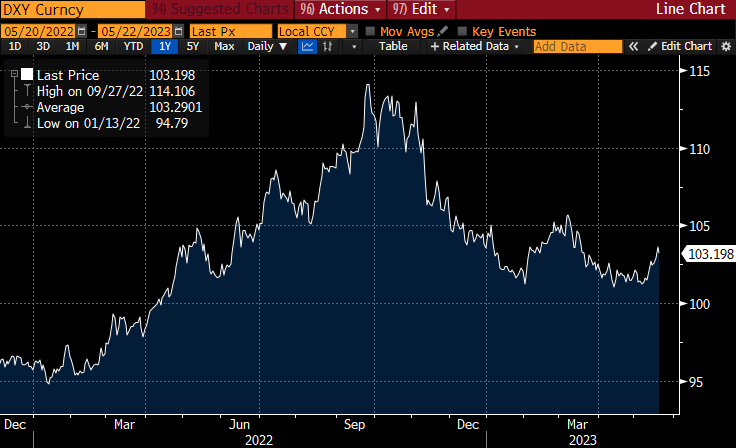
MXWOU
Non-U.S. developed market stocks outperformed U.S. stocks in 2022 and continue to do so in 2023. Part of the story might be a long-run reversion to the mean in valuation ratios, with U.S. stock market’s price-to-book ratio (certainly not the perfect valuation measure) relatively high compared to international markets over the past several years. The other part of the story has been dollar weakness, which has been a tailwind for international stocks. An offsetting consideration is that U.S. growth is likely to accelerate relative to international growth, as the Fed is poised to ease sooner than other central banks.
The white line is the price-to-book ratio of non-U.S. stocks and the blue line is the price-to-book ratio of the S&P 500 index. (Bloomberg)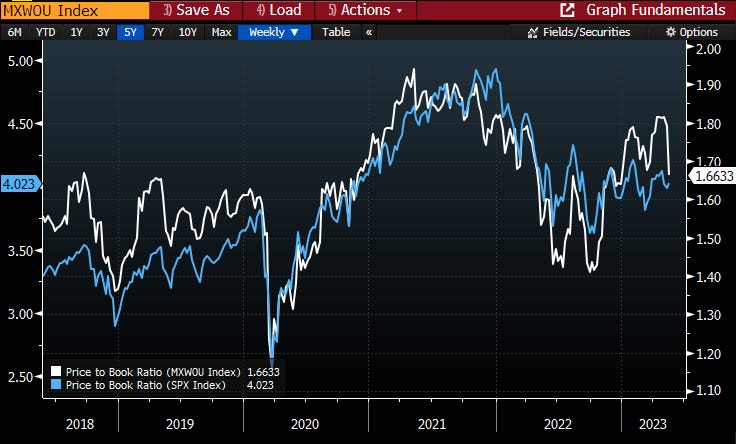
MXEF
Emerging market stocks continue to underperform, as investors struggle to understand how business-friendly the Xi Jinping administration will ultimately be, and as concerns about China-Taiwan tension continue to linger. Erdogan’s likely win in the upcoming election runoff in Turkey isn’t helping investor sentiment.
WBNDXUS
Non-U.S. investment grade international bonds has been the worst performing fixed income sector last year and so far in 2023. Taking the IGOV ETF as a proxy for this asset class, the top ten exposures are to Japan, France, Italy, Germany, Spain, Singapore, Canada, Finland, Australia, and the Netherlands. Given last year’s dollar strength, the underperformance of non-U.S. bonds in 2022 is not surprising. This year’s weakness likely reflects the market’s perception that non-Fed central banks still have more policy tightening in the pipeline. If the dollar weakens and if growth slows internationally as well, one might expect quality non-U.S. dollar bonds to rally later in 2023.
Takeaways
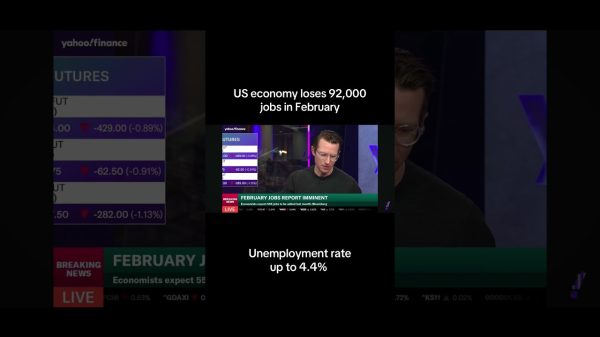
The main themes thus far in 2023 – tech stock rally, bank and CRE weakness, lower rates, weaker dollar – look set to continue for the remainder of the year. Commodities, very much out of favor with the fast money crowd, remain a wildcard. Investors will be keenly watching inflation and economic growth data. The current consensus is that the Fed and other global central banks have done enough to generate slower growth and lower inflation. The extremely strong U.S. job market remains the fly in the ointment. Should inflation and growth surprise on the upside, a wholesale reassessment of what to expect in the rest of 2023 will ensue. We’ll be watching.
As always, investors need to structure their portfolio to properly reflect their own risk tolerance and liquidity needs. This article is for educational purposes only and does not constitute investment advice. Unless you are a sophisticated investor, please do not invest without first consulting a financial professional.
Key to Data
The next table gives the description of each of the asset classes shown in the performance table at the beginning of this article.
QuantStreet, Bloomberg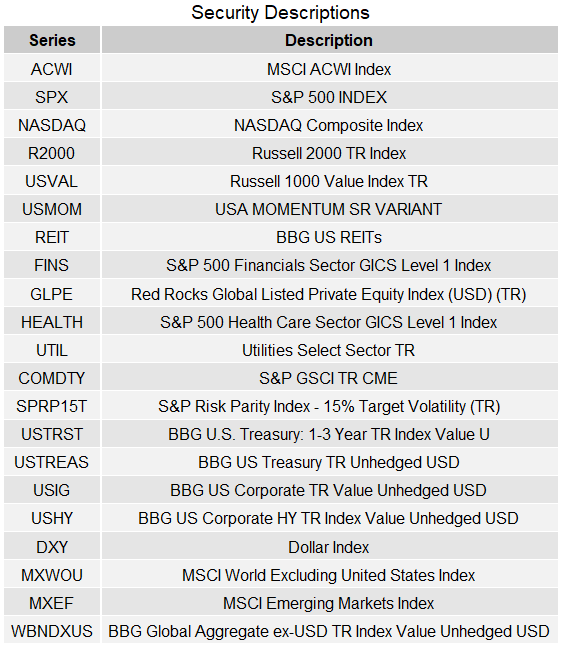
Read the full article here