The Macro View
The next three to six months will provide sufficient evidence to resolve the war between The BULLS and BEARS that has kept the S&P 500 rangebound for about 5 months. The BULLS will reference the ~16% rally off the October lows, but as I have declared – “this isn’t the start of a new BULL market”. There will be more work and additional steps needed to change the trend that has been in place since May 2022.
A strong labor market has extended the economic cycle and supported the soft-landing scenario that is making the rounds these days. Earnings have remained resilient, and the Bullish case is being bolstered by the contrarians who cite “light” positioning by money managers and extreme bearish sentiment.
First-quarter GDP and inflation support a view that stagflation is right around the corner. The data tells us the economy is slowing, and inflation is stubborn. Real growth was only 1.1% on an annualized quarter-over-quarter basis. That was well below expectations of 1.9% and the previous quarter’s 2.6%. When we dig into the details half of the economy’s growth came from January’s 45% surge in new car sales. I doubt if anyone can state with conviction when any recession will start, but rest assured we will continue to see deterioration and drift into a slow/no growth environment.
The recent core Personal Consumption Expenditures (PCE) Index—the Federal Reserve’s favorite inflation gauge—came in hotter (4.9%) than the expected 4.7%. The previous quarters reading was 4.4%. In my view that was enough to keep the Fed raising rates as they did in the recent May meeting. The Fed continues to say they are data dependent and along with investors will just have to wait and see what develops before the June FOMC meeting.
Regardless, the improvement in core PCE has been slow (as predicted), and when we add that to a slow/no growth scene it wreaks of stagflation. With the S&P hanging around the 4100-4150 range it would seem investors are not discounting that probability. Stagflation is just one of the reasons I’ve been saying that once the Fed reaches a Fed Funds rate, they are comfortable with they will remain on a LONG pause, despite the rising threat of any recession. They simply have no choice. Inflation is a regressive tax, that the Fed is determined to squash. Yet, there remains a contingent that has been on the wrong side of the Fed since last summer and continues to be wrong in forecasting rate cuts.
For businesses and consumers that equates to actual gains becoming more and more difficult to attain. The scene stays difficult to figure out when we stack up the non-existent GDP growth that is forecast against analysts that are expecting a strong rebound in the second half of the year. Someone has something wrong, and we could see a reckoning of sorts as the year plays out. Either GDP will be strong or earnings estimates are overly enthusiastic.
Then there is banking stress. No, I don’t see a plethora of new bank failures on the horizon, this is going to be more of a slow-motion train wreck. Lending is slowing and that can have a longer-lasting effect. Banks will be facing greater regulatory scrutiny and a higher cost of funds. We’ve seen that the technical charts of the financial sector have broken down (more pronounced with regionals) and that won’t be repaired overnight. That leads to a situation where the entire sector won’t be of much assistance in rallying indices higher. With that sector out of the equation, it makes it hard for me to embrace a full-blown BULL case.
The Debt Burden
Finally, no matter how this shakes out one issue that is going to now be part of the MACRO scene for a long time is U.S. debt. The debt ceiling debate, which at some point gets resolved, will now put a much-needed spotlight on this problem that is on an unsustainable path.
The equity market continues to be challenged by plenty of headwinds. The economy will continue to be under pressure. That has a way of eventually bleeding over to corporate profits. Liquidity and credit conditions are present and a pause in the rate increases won’t be the tailwind many believe it will be given the inverted yield curve. However, in the near term, this equity market remains resilient, and that is a noteworthy development. Right now we are in a stalemate situation where there is no compelling case for a surge to all-time highs. However, it’s also tough to come up with a scenario now that stocks retreat to new lows anytime soon.
We have a market backdrop where every day is a struggle for both the BULLS and BEARS. This week the “pain” trade moved clearly into the playbook the BEARS are using. The best near-term strategy is to stay with what has been working. There are stocks in BULL market trends that continue to provide opportunities for profits. There is little reason to look elsewhere until this MACRO scene improves.
The Week On Wall Street
After five straight days of losses and declines in nine of the last ten DJIA trading sessions, the BULLS were looking to change the script as the trading week began. It was more of the same as Monday started by seeing the indices trade just above or below the flatline. Buyers stepped up at the end to push the S&P into positive territory at the close.
Tuesday was a weak session with 87% of NYSE operating companies declining and almost 90% of the volume coming in declining stocks. That seemed to be signaling continued weakness in the markets was the next phase. Instead, this bipolar market decided to fool most investors once again and rocket higher on both Wednesday and Thursday. The S&P set a new recovery high off the March lows and now looks poised to take out the August highs. Meanwhile, everything AI (Artificial intelligence) kept the Technology momentum alive sending the NASDAQ 100 well past its August high.
After a two-day, 2% rally, the trading on Friday was “mixed” and the S&P closed flat but broke a two-week losing streak by gaining 1.6% this week. Overall a positive week for the equity market and the Tech Sector remains on fire with the NASDAQ adding 3% this week.
The Economy
The Leading index fell 0.6% to 107.5 in April following the 1.2% plunge to 108.2 in March. It is the 13th straight decline in the index. It is the worst string of losses since the 24-month consecutive declines from early 2007 to early 2009. The index is at its lowest level since September 2020 and was at an all-time high of 117.8 in December 2021. Of the 10 components that make up the index, 6 made negative contributions, led by average consumer expectations.
LEI (www.conference-board.org/topics/us-leading-indicators)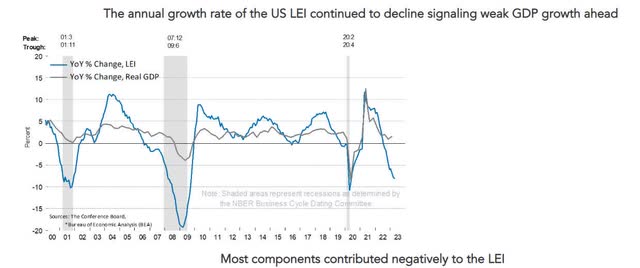
The LEI report would suggest the US economy is approaching, if not already in, a recession.
Manufacturing woes continue in NY and Philly;
NY Mfg. (www.newyorkfed.org/survey/empire/empiresurvey_overview.html)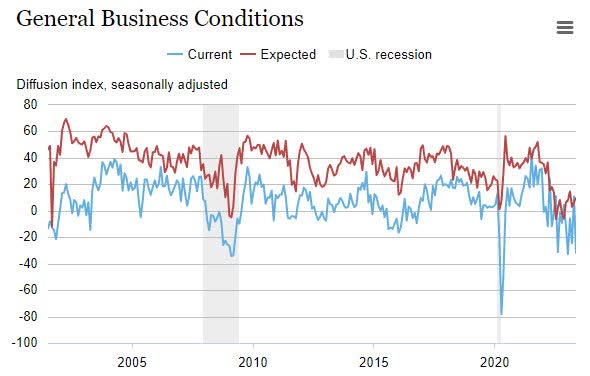
The Empire State manufacturing index plunged 42.6 points to -31.8 in May, much weaker than expected, after popping 35.4 points to 10.8 in April. It is the lowest since the 2-year nadir of -32.9 in January. Weakness was broad-based.
Despite rising from -31.3 last month to -10.4 this month, the Philly Fed manufacturing Index remains in negative territory for the ninth straight month.
Philly Fed (www.philadelphiafed.org/)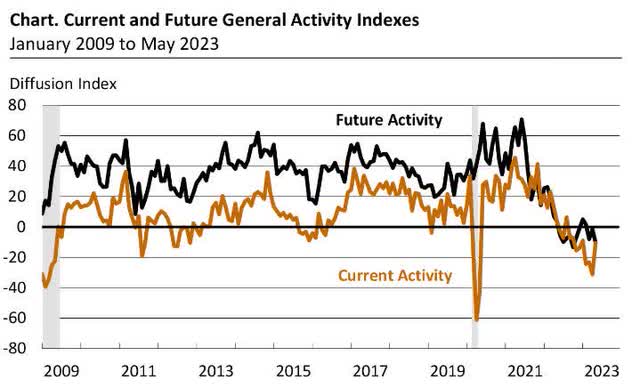
Nearly 35 percent of the firms reported decreases (unchanged from last month), exceeding the 25 percent reporting increases.
April industrial production increased by 0.5%, beating forecasts, after an unchanged print in March. Manufacturing production jumped 1.0% following the 0.8% drop in March.
Consumer
April retail sales increased 0.4% both overall and excluding autos. These follow declines of 0.7% in March and -0.7% in February. The major components were mixed.
April Retail (www.tradingeconomics.com)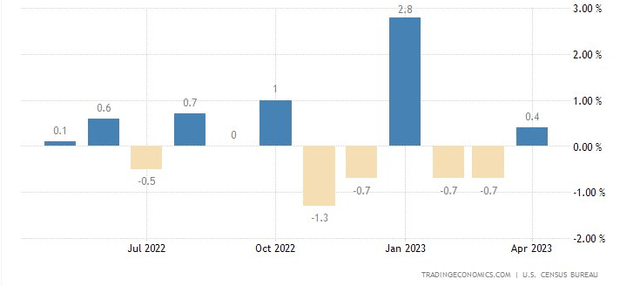
Four of the last six months have reported declines in sales.
Consumer DEBT
Through Q1, total outstanding credit topped $17 trillion, growing at a decelerated rate of 7.6% YoY versus a peak of 8.5% at the end of 2022. Mortgage loans continue to account for the largest share of that debt, and appear to be the main driver of the slowdown in credit growth.
Non-mortgage debt grew at an accelerated 7.3% YoY clip, the fastest rate since Q1 2008. Credit card growth has led non-mortgage categories to rise by a record 17.2% YoY. Home equity revolving credit is also growing at the fastest rate in over a decade while student loans are growing at one of the slowest paces on record.
While numbers in the trillions are staggering, we need to keep the consumer debt situation in context. The way I approach that is by watching the various components (auto-loans, Credit cards, etc) of delinquency stats. They are ticking up slightly, but so far, they remain benign. Credit cards are the most prevalent with seriously delinquent loans at 8.24%, however, that is well below the highest levels (13.5% -14%) from the 2009/10 period.
Housing
The NAHB housing market survey index surged 5 points to 50 in May after edging up 1 tick to 45 in April. This is the first time back at the 50 mark and is the highest since the 55 in July. The present single-family sales index also popped 5 points to 56 after rising 2 points to 51 previously. The future sales index climbed 7 points to 57 following the 3-point gain to 50.
The Housing starts report slightly undershot estimates, with overall starts and starts under construction figures that largely tracked assumptions, but a modest undershoot for permits and a surprising big April drop for completions that was likely just noise. Housing starts rose 2.2% to a 1.4 M pace. Starts under construction rose 0.4%. Building permits fell 1.5% to a 1.41 M pace. Housing completions plunged 10.4% to a 1.37 M pace.
Existing home sales tumbled 3.4% to 4.28 million in April following the 2.6% decline to 4.43 M in March. Single-family sales dropped 3.5% to 3.85 M following the 2.7% slide to 3.99 M in March.
Exist. Home Sales (www.nar.realtor/)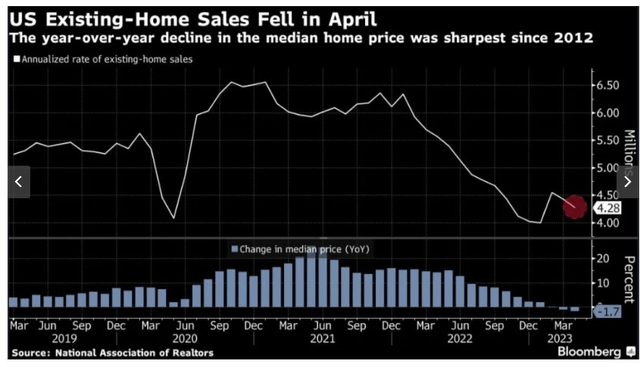
The median sales price rose to $388,800 after climbing to $375,400 in March. This is the highest price since August and compares to the $413,800 record peak from June.
The Global Scene
Despite increases from the prior month’s results, many analysts viewed the data out of China this week as disappointing.
China’s industrial output grew 5.6% in April from a year earlier, missing expectations by a large margin but accelerating from a 3.9% gain seen in March. Retail sales jumped 18.4%, missing forecasts for a 21.0% increase. It was significantly faster than the 10.6% increase in March and marked the quickest growth since March 2021.
The Fed
This week investors were treated to a host of “Fedspeak”, and the general takeaway was; The Fed may not be done raising rates. Fed Funds futures which had been signaling a “pause” in June are now pricing the chance of another 25-basis point hike at 30%.
The fixed-income market finally got that message today as both the 2 and 10-year Treasury yields moved higher, closing the week at 4.27% and 3.68% respectively.
Political Scene
There was one takeaway from this week’s meeting between the President and the leaders in Congress. After four months of repeating that they would not negotiate, the administration is now open to “negotiating” the Debt Ceiling issue.
One of the issues on the table is reimposing a work requirement for the millions that are receiving government food stamp benefits. This seems to be a “key” since one side says it’s a “non-starter” while the other side said it’s a “must have”.
The average monthly benefit for the country’s food stamp program reached an all-time high in November 2022, more than double the assistance before the pandemic in 2019. Today 42 million are receiving that enhanced payout. That is despite the more than 9 million job openings available (about 1.6 jobs for every unemployed individual), and the reason is simple. There was a nationwide suspension of the food stamp work requirement for able-bodied adults without dependents.
With US debt now at all-time records. It should be a bipartisan effort to start to rein in spending. The interest payment on the present debt load is only going to be more of a burden as time goes on. We are set to pay more in interest payments in the next 10 years than we have in the last 80.
It makes no difference how we got here, the fact is we are in this situation TODAY and unless this is turned around, the economy and the stock market of the future are not going to look anything like what we have seen in the 10 years leading up to this BEAR market.
All looked well going into the Friday session, but a headline crossed indicating a breakdown in the negotiations. So it appears we are now back to a last-minute “save” to avoid what would be a calamitous event for the markets. The market took that headline in stride, indicating not many are interested in selling stocks lately.
Anyway, I’m not so sure what happens if a deal is reached. With the market rallying hard recently, if we get a deal, I won’t be shocked if we see a “sell on the news” event. Only large givebacks on spending (a positive) might spark more buying but I don’t see that occurring.
Earnings
The market has essentially traded sideways since the big banks kicked things off in early April, but compared to many of the dire warnings that were out there, things have turned out well. Despite the ongoing banking concerns, S&P 500 earnings growth has gradually improved this quarter, with Q1 results down -2.0% on a year-over-year basis, That was an improvement from over -6.0% YoY forecasts at the start of the quarter.
Over 91% of S&P 500 companies have reported. A resounding 78% of companies have beaten consensus EPS estimates and, in the aggregate, companies are beating earnings estimates by ~7%. Importantly, more than 40% of forward earnings guidance is above consensus.
Cost-cutting efforts have led to improved margins and comments from bank CEOs implied that the worst of the banking turmoil may already be behind us. All of this adds a little more confidence that the ~ $215 consensus earnings forecast for 2023 is achievable.
Unlike the last three earnings seasons, performance during the current period has been remarkably sideways. On the surface, the lack of much upside during the current earnings season may be considered a negative signal. Then again, when you consider the fact that the market started to sell off after each of the last three earnings rallies, maybe the lack of an earnings rally means the odds of a post-earnings hangover are less likely.
Another indicator that leaves investors in limbo.
Food For Thought
Another reminder that investors are laboring in an anti-business environment. This past week the FTC decided to block the proposed Amgen takeover of Horizon Therapeutics on “Monopoly” concerns.
That tossed plenty of cold water on the entire Biotech sector today taking the Biotech ETF (XBI) down nearly 3%. Tossing handcuffs on the sector and stifling innovation is a sure way to stifle growth. Most liberal market analysts are having a hard time understanding this decision because there is simply no overlap between the two entities.
Critics complain of brazen drug price increases and now Amgen (AMGN) will spend millions trying to overturn this decision, adding more costs to drug development. The company’s response “This acquisition has the potential to accelerate the availability of important rare disease medicines to more patients worldwide.”
The Daily chart of the S&P 500 (SPY)
The 4200-resistance line is clearly defined on the DAILY chart of the S&P 500. We’ve seen a brief trading top that crossed the 4200 level, but haven’t seen a close above that resistance line as of yet.
S&P 500 (www.tc2000.com)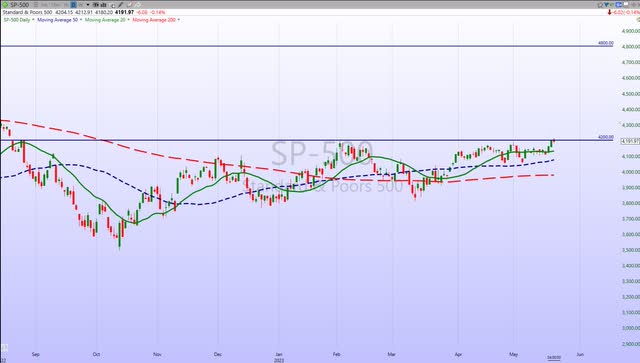
For many investors that is an important area that would determine where the S&P heads next. A decisive breakout above 4200 opens the door to test the August ’22 high of 4305.
Investment Backdrop
This past week was the beginning of the end of earnings season and the focus was on the consumer. Retail sales were positive but lower than estimates. Home Depot (HD) started the week off by reporting its largest revenue miss in 20 years and slashing guidance. However, Target (TGT) posted mixed results but Walmart (WMT) with its more diversified product mix, posted an impressive quarter and raised guidance. Most of the other retailers noted that continuing inflation is handicapping the low- middle-income consumer keeping them locked into spending on essentials and not much else.
Not many knew what to make of the recent stock market action that saw the S&P complete its 7th straight trading day in a tight 56-point trading range. I’m sure it has happened before, but it seemed very unusual while it was occurring. Narrow trading ranges make it harder and harder to interpret the price action. They say “Don’t ‘Short’ a dull market” and if that holds true this time around, then the coiling action could unleash a blow-off move to the upside. Perhaps Wednesday’s strong upside push was the start of that move. After all, we haven’t seen anything resembling an obvious “sell signal,” such as a huge down day on a big volume or exhaustion move higher. That leaves the BUY side option on the table.
The large-cap tech names make new 52-week highs almost daily, as Apple’s (AAPL) market cap now exceeds the entire Russell 2000. It’s noteworthy that selling is immediately bought, and the semiconductors and NASDAQ seem impervious to any “give-back”. All are reasons to stay positive. The S&P 500 has been trending sideways recently, but when mega caps are excluded, the trend shifts to a short-term downtrend. In other words, the S&P 500 is up solidly YTD with an 8+% gain, but without mega caps, the index would be right around flat.
That describes why it’s been a tough market to navigate. It’s one small group and it’s virtually nothing else. Another testament to staying diversified, and not abandoning any sector entirely. Admittedly I have not jumped into the “HOT” trades this year, as I have chosen not to be “aggressive”. However, my CORE tech holdings, AAPL, AMZN, MSFT, GOOG, NVDA, etc. have helped ease some of the frustration of trying to figure out this market.
Meanwhile, Retail sales are underwhelming, and plenty of other economic data is flashing recession. Market bifurcation exists as we see the NASDAQ on the cusp of a breakout to challenge the August highs, while the Russell 2000 and Dow Transports look like they are muddling along looking more Bearish in hopes of finding a support zone.
On the International scene, analysts report that data out of China isn’t overwhelming, indicating the “re-opening” is now a muted affair. That sentiment keeps the “cyclical trade” including crude oil in a box indicating we may be headed for weak global growth.
Unless an investor is overloaded with stocks that are involved in the Artificial Intelligence mania, they are probably scratching their head. Regardless of the current momentum trade, caution and confusion is probably the best way to describe the continuing frustrating market scene. With earnings season wrapped up, it’s back to wondering if the next catalyst will be the debt ceiling negotiations.
Bifurcated Market
The Bifurcated market scene continues. When trading ended on Friday, the DJIA was up three days out of the last fifteen, and down two of the last three weeks.
The Nasdaq, on the other hand, has been up in seven of the last eleven trading days and posted four straight weekly gains.
Small Caps
The Russell 2000 is telling a somber story on the economy. This scene is weaker than the DJIA and the other indices.
Dow Transports
Dow Transports are lagging – and it might be another red flag or just more of the bifurcated market we are in. Transports are economically sensitive and often lead the broad market. It’s not a great sign that the Transports have lagged behind both the Dow Industrials and the S&P 500 since the February highs.
The index is in a sideways pattern with more of a lean to the downside. “Price” is struggling to break the short-term trend lines which are now trending down. The S&P 500, for example, is back up to its February high, but the Transports still have quite a bit of work to do to catch up. They are 11+% below February prices.
Sectors
Energy
The Energy ETF (XLE) has taken on a very tenuous look. If we don’t get a rebound rally soon, this short-term picture can get ugly. The longer-term trend is still BULLISH, but this decline is testing that trend now.
Financials
The Financial ETF (XLF) was following the ‘technicals’ in a textbook fashion as it rode the resistance trend line lower. A rebound rally had enough momentum to break above near-term resistance this week.
There is still plenty of overhead resistance and I don’t believe we can expect to see a quick turnaround, “V” shaped recovery soon. Meanwhile the poor action in the regional banks, which broke down to new lows recently also rebounded sharply. Investors can expect more of the same, weak rallies that will be sold until the downtrend plays out.
With as oversold as many of these stocks were, it didn’t surprise me to see a big bounce at some point. The bigger picture chart shows the potential risks, so it’s hard for me to get too bullish on them for anything more than a quick bounce trade.
The BEST investors can hope for is a trading range at lower levels that will eventually build a long-term base. In this case, like so many other severe breakdowns, we are talking months, not weeks for all of this to play out.
I still believe we do NOT have a banking crisis at hand that is going to morph into something like 2007/2008. However, SENTIMENT rules, and despite the week’s rally, this is not what I would call a BULL market setup.
Fixed Income
I don’t have a strong conviction right now on the direction of long-term rates/bonds. Like the equity market, I can make a case in either direction, and it looks as if the market is torn too because a measure like the iShares 20+ Year Treasury Bond ETF (TLT) has been going sideways since late last year. I’ll add that it is still mired in a BEAR market trend.
There has been clear resistance that has knocked the ETF back down several times now, but it has not resulted in a drop in bonds in any meaningful way. It just feels like the first move out of this range is going to be the wrong one, so we need to watch closely the year-to-date highs and lows. When we do start to get a break, I expect it will garner a lot of attention, but I will be skeptical of any move unless it can hold for several days.
Healthcare
Given its makeup, the healthcare sector’s earnings drivers, which tend to be related to innovation, population growth, and even global events like pandemics, are broadly noncyclical. Company earnings and revenues, therefore, are less correlated to prevailing economic growth (see chart), resulting in potential portfolio diversification benefits.
The healthcare sector also offers exposure to innovation themes, including genomics, artificial intelligence, and robotics—providing investors with an attractive combination of offense and defense. I continue to favor the sector in a weakening economy.
The DAILY chart of the Healthcare sector (XLV) is neutral and has also settled into sideways mode.
Biotech
Many views biotech, which generally comprises smaller companies developing early-stage drug candidates, as the “venture capital” of the healthcare industry. The upside can be material in the event of commercial viability leading to an acquisition by a large pharmaceutical company seeking to improve its pipeline.
Given that stock performance is linked to drug trial success, the industry is highly idiosyncratic. Macro factors can also impact the industry, as prevailing interest rates and the mergers and acquisitions (M&A) environment can influence sentiment. Unfortunately, that was brought into question this week, given the FTC’s position on “mergers” in general. In the Amgen- Horizon Pharmaceutical situation, a victory on appeal (HIGH probability), will go a long way in bringing not only common sense but renewed interest in the group. I would use the weakness caused by the FTC headline as an opportunity to pick up select names. By their nature, biotech companies are long-duration investments, as cash flows are only realized after trial data and commercialization, which can take a long time.
This long-duration exposure has weighed on relative industry performance in recent years as rates have normalized amid hawkish monetary policy. This technical pressure may be slowly subsiding as the Fed is another step closer to ending the rate hikes. As such, biotech valuations may offer an attractive risk/reward as fundamentals come back into view. In an environment where pharma companies have excess cash to deploy to M&A to replenish pipelines, biotech can offer the opportunity to go along with the inherent risks.
This might be one of the reasons the group caught fire in April. Since March 23rd the Biotech group (XBI) has rallied ~19%. The XBI is once again a point or two from overtaking a long-term downtrend line that has capped this ETF since November ’21. Overall, it is a group to watch for “trading” entry points.
Gold
After a leveling off in the trajectory, the recent uptrend was dashed this past week. As noted recently, overhead resistance is still difficult to overcome around the $193 range. Last week’s analysis;
It’s now a matter of whether a breakout will occur that can kick off a rather large move or a rejection sending the ETF into the trading range to consolidate.
For the moment, the ETF has chosen the latter, but I remain BULLISH on the longer-term prospects for the metal.
Silver
Silver (SLV) broke the short-term uptrend that moved the metal about 30% since early March. The intermediate and longer-term trends are intact, but it will have to hold these levels ($21-$22) for that to be the case going forward.
Technology
The NASDAQ 100 (NDX), which is being helped by the big moves in the large-cap tech names has broken above its long-term moving average for the first time since April 2022. This price action highlights the bifurcation that exists in the overall equity market today. We’ll need a little more evidence to ordain this as a genuine breakout and with the index taking out the August highs, investors will clearly have to sit up and reassess the situation in large-cap tech.
Semiconductors Sub-Sector
The Philadelphia Semiconductor Index (SOXX) entered the week with a “questionable” chart pattern. After a lousy April where the SOXX fell 7.3%, the index rallied 7.8% this week and looks ready to break even higher. The fundamentals for the group have been mixed. We have seen excellent results for some companies while others have been disappointing. I noted in my trend research report that only 5 stocks are now in defined uptrends, indicating the group is being held up by the likes of Broadcom, AMD, and Nvidia. While Broadcom (AVGO) is not considered expensive, Nvidia (NVDA) is now selling at 70X earnings
This past week, Taiwan Semi (TSM) issued an interim report indicating a 14% YoY decline in semis sales for April; that’s the second-straight YoY decline in sales and illustrates the slowing of the fundamentals in the semis space. However, enter Artificial Intelligence and that is the driver of this rally. That brings into question all of the hype surrounding Artificial Intelligence, which is starting to look “bubbly”. Investors are bringing forward earnings from AI that have yet to be identified and quantified.
This reminds me of the EV mania, where anything EV was a “BUY”. Other than Tesla (TSLA), (down 50+% from its ’22 high), the other EV stocks are hardly viable players that continue to burn through money.
Final Thoughts
When it comes to the equity market, The BULLS have a “case” and the BEARS have a “case”.
In the shorter term, It may seem like a no-brainer that the stock market would rally after a highly contentious debt ceiling fight ended, but that was not the case back in 2011. A well-respected market technician, Walter Deemer pointed out a noteworthy statistic yesterday. Back in 2011 most of the damage in stocks was done after the debt ceiling agreement was reached. After the agreement was reached on July 31, 2011, the S&P 500 actually fell – almost 17% from the July 31 deal. It’s not an apples-to-apples comparison, but let’s keep in mind that the market does not always behave exactly as it is “supposed” to.
There are plenty of reasons to start following the positive feedback loop that has investors giddy over the AI revolution but there are other more mundane issues that need to be discussed. Historically, the stock market bottoms in a bear market only AFTER the Federal Reserve begins to CUT rates (not pause), during the tightening cycle. Even during the COVID Crash of 2020, the market initially kept going down even after the Fed eased and did not bottom until weeks after the first cut. It was a similar story in 2007-2009 and 2000-2002, except it took more than a year before the final bottom was made.
In essence, investors that are pointing to a pivot by the FED to start buying stocks or are already positioning for that event by getting ahead of the crowd may want to rethink that strategy. Perhaps the recent rally is an indication that some have decided to be the first on board this train they see headed for new market highs.
Betting that the market is going to lead rates by finding a major bottom first is going against modern history. It’s certainly not impossible for it to happen, but it increases the risks of being wrong in assuming a bottom has already formed.
My near-term goal is the same. Stay with what is working and let others “guess” the answers to all of the questions that need to get resolved. This week I will add; I’m not in the chase “Everything AI” mode.
Thanks to all of the readers that contribute to this forum to make these articles a better experience for everyone.
Best of Luck to Everyone!
Read the full article here


