Thesis
I have been a long-term bull on AT&T (NYSE:T) and have been arguing for a bull thesis on SA since early 2022 (when its prices were in the ~$16 range). And of course, it is pleasant to see its robust price advancements since then. However, as a value investor (instead of a momentum investor), higher prices always weaken, not strengthen, my bull thesis. Furthermore, at the same time, the safety of its dividends has been gradually deteriorating and now is on the borderline.
These developments finally led me to conclude about a month ago that it has reached its full price potential under current conditions. I wrote an article to downgrade it and suggest investors consider trimming their T position on April 12 (see the screenshot below). Thanks to pure luck, the article was published almost exactly at the peak of its stock price. And the stock prices have collapsed by almost 17% since then.
Source: Seeking Alpha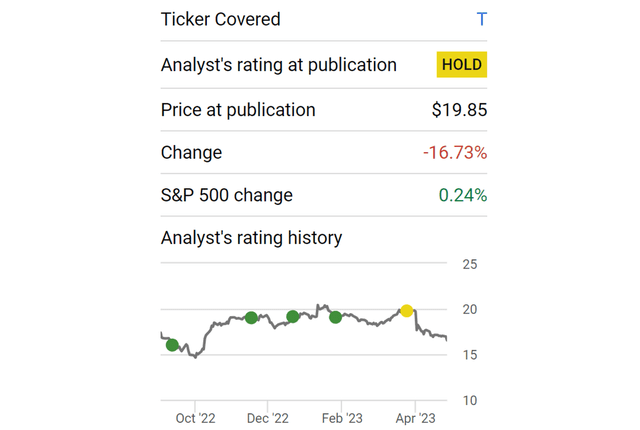
The goal of the above background is not to pretend that I have cracked the dark art of market timing. My readers know that I’m always the first one to confess that I do not have, and will never have, such an ability.
Though I do have two key points to make by summarizing the above background. The first key point is that we do not need perfect timing to be profitable. My experience (which is the same as many other successful investors’ experiences) is that a good sense of getting things DIRECTIONALLY right is enough, and more often valuable than getting the perfect timing (if that is feasible at all).
Piggyback on to the first point, the second point is the central thesis of this article. Given the overall direction of things at T, I am still seeing more downside risks than upside risks even after the large ~17% price correction. In the remainder of this article, I will elaborate on this thesis by examining its valuation risks, financial strength, and operational challenges.
Valuation risks
The combination of T’s price appreciation over the past ~2 years and its weakening fundamentals recently have led to an absurdity in my view. T’s fundamentals are weaker than some of its peers like Verizon (VZ), yet it is now priced as expensive (or even more so by some metrics). We will get to the fundamentals a bit later. Here let me just focus on the valuation part.
As seen in the chart below, the forward price-to-earnings (FY1 P/E) ratio is 6.81x for T, which is about a 12% discount from VZ. Not a huge discount to start with.
Then we will have to bear in mind that T carries more leverage than Verizon. Thus, leverage-adjusted valuation metrics are more appropriate here. Once adjusted for leverage, the valuation gap disappears almost entirely as seen. For example, T’s EV/EBITDA) and EV/sales ratio are within 2% and 3% of Verizon’s ratios, completely within the margin of uncertainties.
In terms of the dividend yield, the absurdity is even more drastic. As seen, T’s TTM dividend yield of 6.72% is BELOW its four-year average yield of 6.93% by about 3% in relative terms. While in contrast, VZ’s yield of 7.21% is substantially above its 4-year average (by 48%). Admittedly, the four-year average yield for T is biased because of its recent spinoff of WarnerMedia and the dividend cuts associated with it. However, as argued in my early article, the safety of its dividends has deteriorated recently and now sits only on the borderline. As a result, I see a non-negligible risk for T to cut its future dividends again.
We will move on to address T’s operational challenges next.
Source: author based on Seeking Alpha data.
Operation Challenges
Reading through recent coverage on T, I get the impression that both bulls and bears acknowledge the many headwinds facing T. So here rather than retreating these issues, I would just add a perspective that is not often discussed in other SA articles published so far. I will analyze its operational challenges from the perspective of its inventory management.
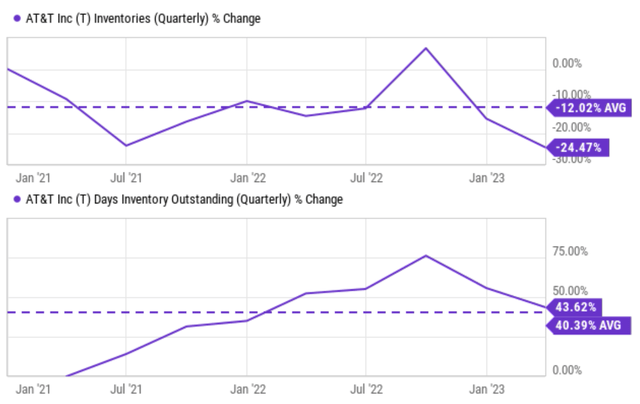
The next chart shows T’s inventory in dollar amount (top panel) and in days of outstanding inventory (“DOOI”). I see a divergence here in the recent 1~2 quarterly: the dollar amount has fallen more quickly (to be below its historical average) than the DOOI (which is still above its historical average). The second chart, which expressed these changes in %, illustrates the divergence more clearly.
To me, this divergence can only be explained by the following possible reasons. And I view all of them to be problematic. Furthermore, clearing a sizable inventory will take time, and most likely be coupled with reduced prices. Thus, I foresee these issues to persist.
- A below-average inventory in dollar amount could be caused by the following factors: A) clearing inventory at reduced prices, B) write-off of inventory (e.g., due to obsolescence and perishability), and C) of course, the good scenario of robust sales. Given the recent market conditions and the divergence between the dollar amount and DOOI, I think we can safely rule out possibility C.
- An above-average DOOI indicates that a business is taking a long time to sell its inventory compared to the average for its industry or historical performance. This can suggest potential issues in inventory management, such as overstocking or slow sales. A higher DOOI also means more capital is tied up in inventory, which can impact a company’s cash flow.
Source: Seeking Alpha Source: Seeking Alpha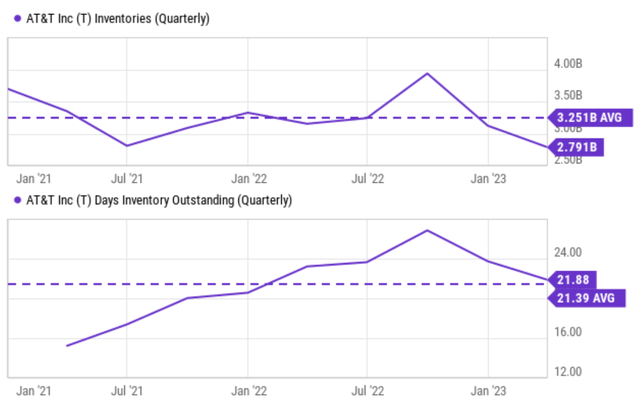
Other risks and final thoughts
In addition to the aforementioned challenges, investors should also be prepared for greater price volatility when investing in T. As seen from the next chart, T’s beta is approximately 1.7x to 2.2x higher than VZ’s over the past 2-year to 5-year window. We’ve touched on T’s weaker financial strength earlier. And the Altman Z Score is shown below further accentuates this point. This is a metric that assesses a company’s financial health and the likelihood of bankruptcy. Higher scores indicate lower bankruptcy risk. As seen, the Altman Z Score for T is 0.68, only about ½ of VZ’s score of 1.29, which suggests a higher risk of financial distress.
Source: Seeking Alpha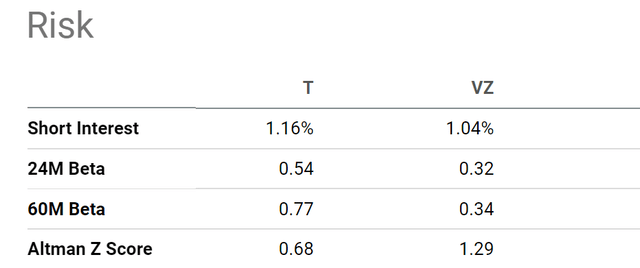
Upside risks. Despite all the challenges, consensus estimates do project slow growth ahead, at an annual growth rate of about 0.91% CAGR as seen below. And T’s valuation is indeed compressed on an absolute basis. Its P/cash flow ratio currently hovers around 3.4x only, substantially below its historical average of 4.18x by ~19%. A combination of profit growth and valuation expansion could lead to a positive return. As shown below, my estimate for the best return scenario is about 5% per annum with a dividend included.
However, I do not feel such a return profile to be attractive given the risks involved. My concluding thought is that the downside risks are currently the dominating forces, and far outweigh the upside risks.
Source: author based on Seeking Alpha data. Source: author based on Seeking Alpha data.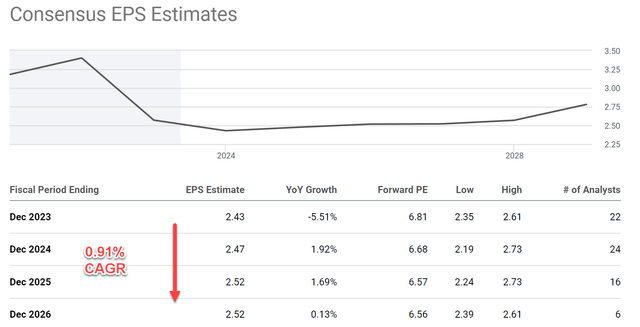
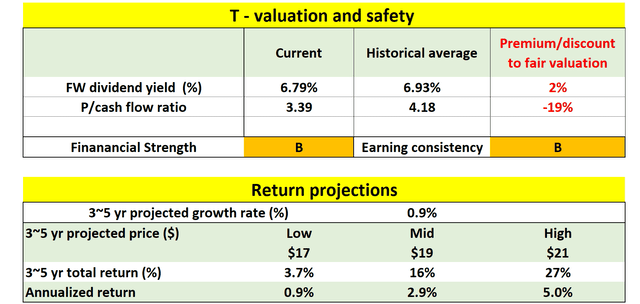
Read the full article here


